


Election vs. Earnings: Market’s Coming Dilemma
Midday Macro - Color on Markets, Economy, Policy, and Geopolitics

The melt-up in U.S. equities continues, but with valuations high and pricing perfection, reduced risk appetite due to the fast-approaching U.S. election may outweigh positive Q3 earning results, stalling the current rally
The longer-term trend in rates may be more dependent on election results than incoming economic data, given diverging fiscal path outcomes, but slowing fourth-quarter growth means yields are likely near the highs of their range
Through all of this, the Fed will maintain its rate-cutting course due to the need to adjust policy but not meaningfully ease it
The party continues for equities despite increased uncertainty…
We are ending the week with the S&P continuing to rally and hitting another new all-time high, while yields have also moved higher, especially in the long end, steepening the curve and retracing much of last week’s flattening.
Today’s cooler-than-expected PPI reduced worries that disinflationary progress has stalled, as seen in yesterday’s firmer CPI readings. Further, most of the reacceleration in September’s CPI report will not translate over into PCE, leaving the Fed’s go-to measure of inflation likely to continue its downward trajectory.
With the S&P 500 up around 20% in 2024, adding over $8 trillion to its market cap, the focus is now shifting to the Q3 earnings season amid a macro backdrop of economic and geo/domestic political uncertainty. Analysts have reduced earnings growth projections, raising concerns about the sustainability of the market’s rally to valuations that are “priced to perfection.”

S&P 500 implied volatility has been significantly higher than realized volatility due to the upcoming earnings season and elections…
The equity market’s positive gamma positioning has allowed implied volatility to stay consistently (and now notably) higher than a lower realized volatility. The underlying positive gamma positioning is mainly driven by 0DTE flows, which increase when the “coast is clear” following new economic data releases. On top of these flow dynamics and increased put buying for hedging purposes into the election, there has also been an increase in VIX call buying for protection, supporting higher implied vol.

This has led the spread between realized vol and implied vol to widen to levels rarely seen. If a whiff of material risk materializes, these dynamics causing this occurrence will quickly reverse as 0DTE players pull their short-vol/gamma offers and liquidity dries up, causing a more violent move lower in equities.

However, given no larger adverse risk event, this is a well-hedged market. If there is a “clean” election and geopolitical risks cool, reducing the need for downside protection, then all that built-up hedging positioning will be closed, which will be a strong tailwind for a year-end rally in U.S. equities.
Unfortunately, more tactically, the current volatility dynamics into the election mean equities may have a hard time sustaining a larger move higher. Next week’s OPEX may lead to indexes getting stuck to current levels.
Finally, this current volatility dynamic is also creating a divergence between what equity markets are telling us (about potential risks) versus what credit markets are. Basically, equities are pricing in risks (through higher implied vol) that the credit markets are not bothered about. When listening strictly to credit spreads, things haven’t been this rosy in almost two decades.

Equities are not cheap, and returns for the year are already historically high…
With the S&P Index rising to ATHs, forward earnings have also been rising into record-high territory. During the current bull market, the S&P 500 forward P/E has increased from 15.3 (October 2022) to around 21.6 currently. That’s not a record high, but it is getting closer to the 25.5 reached in 1999.
When we put this on top of the fact that S&P returns year-to-date are well above expectations, especially for an election year, we are looking at a market that is priced to perfection with a notable risk event fast approaching. As a result, if you are not already in long equities, there is little reason to chase this rally into the election.

Despite the larger kick-off rate cut, the Fed is not easing policy…
The September FOMC minutes had a more hawkish tone to them, indicating the Fed’s intention is still very much to adjust policy in line with disinflationary progress, not ease it to support labor markets. Powell now sees labor market conditions as not contributing to inflation but also as not being weak enough to warrant the easing of policy. This could change, but in the end, the 50bps cut was catch-up for not going 25bps at the July meeting (given the disinflationary progress that has occurred), nothing more.
Supporters of the larger cut “generally observed that such a recalibration of the stance of monetary policy would begin to bring it into better alignment with recent indicators of inflation and the labor market,” said the minutes. Some of those officials thought there had been a “plausible case” to make a quarter-point rate cut at the previous meeting at the end of July and that more recent data had only firmed up the justification for lowering rates, according to the written account of the meeting.

Further, we do not see the 50bps cut as a policy error due to the stronger September jobs report and a firmer September CPI reading. We believe there will be some payback in both of these readings in next month’s data, and as a result, we don’t see a change in the current longer-term trends of looser labor markets and choppy disinflationary progress.

Economic activity got pulled forward in Q3…
To support our view that the Fed should keep cutting rates to ensure policy doesn’t become too restrive, we believe that much of the strength in the third quarter will be at the expense of the fourth.
We all know that well-anticipated port strikes drove increases in exports while worries of coming tariffs (if Trump wins) increased inventory accumulation. Both of these areas were initially projected to be a drag on third-quarter GDP growth but ended up being tailwinds.

Export growth is expected to fall in the fourth quarter, according to PMI readings. Inventory accumulation is also now facing seasonal headwinds, and in combination with falling capex intentions, overall “investment” is likely to run below-trend into year-end.

This leaves us with a fourth-quarter growth story heavily reliant on a resilient consumer, something that could certainly occur, but also leaves the skew of outcomes favoring a weaker overall aggregate growth story, given the rest of the contributing components to GDP will be weaker.
Inflation volatility has risen and will mean the path of policy is more uncertain…
The increase in core CPI in September was due to components that are often volatile and do not influence the core PCE deflator preferred by the Fed. Both airline fares, which rose by 3.2% MoM, and auto insurance prices, which rose by 1.2% MoM, will not feed into the core PCE calculation, as PPI data is used instead.

Apparel prices increased by a notable 1.1% MoM, a significant upside surprise, moving core goods higher on a month-over-month basis for the first time since the beginning of the year. However, just like the start of the year, this may be a one-time jump due to the increased costs of rushing imports, which could reverse over the next few months (as happened then). Excluding apparel, core goods prices fell by 0.06% MoM, with slight rises in new and used autos prices of 0.2% MoM and 0.3% MoM, respectively, offset by broad-based weakness elsewhere.

If there’s reason for concern, it’s that the period of meaningful disinflationary gains seems to be over, with headline inflation still above 2%. TS Lombard’s Stephen Blitz produces a diffusion index of the proportion of Consumer Price Index components whose three-month average is higher than their 12-month rolling average, a measure of whether the trend is increasing or decreasing. On that basis, it looks like inflation has come to rest at a level that is still too high for comfort.

Putting it all together…
The election is fast approaching, and its outcome has the potential to change risk appetite significantly. As a result, we aren’t too eager to take on new positions despite a stronger conviction that growth will slow more meaningfully in the fourth quarter.
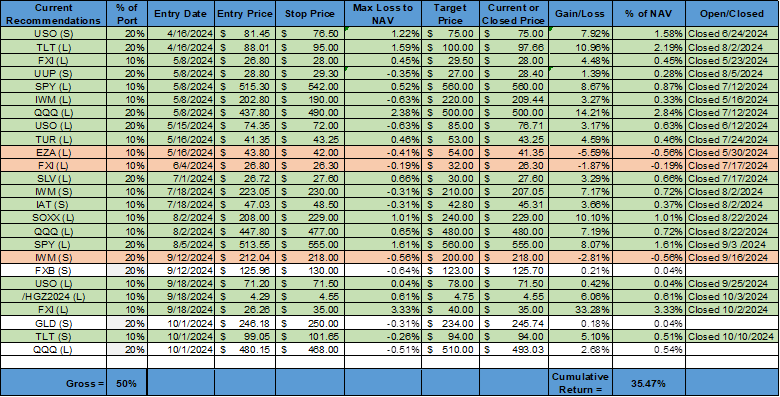
We maintain our bias to be long USD through our GBP and gold short positions.
We are closing our short long-end Treasuries position (through $TLT) in the mock portfolio, having reached our target, locking in a 5% gain in two weeks. We see Israel’s coming retaliation on Iran being more measured, and with its passage, a reduced risk premium is needed in oil prices, and hence less pressure on real rates to rise. We also see this reduced geopolitical risk premium more generally weighing on gold.
We maintain our Nasdaq long position but have moved our stop higher to lock in some of the small gains we have.
We plan to go into further detail next week about why we believe fourth-quarter growth will face greater headwinds and payback from the above-trend level in the third quarter.
As always, thank you for reading, and please share our newsletter if you like it and know others who may enjoy it.
Please feel free to reach out with any questions or comments. – Michael Ball, CFA, FRM
VIEWS EXPRESSED IN “CONTENT” ON THIS WEBSITE OR POSTED IN SOCIAL MEDIA AND OTHER PLATFORMS (COLLECTIVELY, “CONTENT DISTRIBUTION OUTLETS”) ARE MY OWN. THE POSTS ARE NOT DIRECTED TO ANY INVESTORS OR POTENTIAL INVESTORS AND DO NOT CONSTITUTE AN OFFER TO SELL -- OR A SOLICITATION OF AN OFFER TO BUY -- ANY SECURITIES AND MAY NOT BE USED OR RELIED UPON IN EVALUATING THE MERITS OF ANY INVESTMENT. THE CONTENT SHOULD NOT BE CONSTRUED AS OR RELIED UPON IN ANY MANNER AS INVESTMENT, LEGAL, TAX, OR OTHER ADVICE. YOU SHOULD CONSULT YOUR OWN ADVISERS AS TO LEGAL, BUSINESS, TAX, AND OTHER RELATED MATTERS CONCERNING ANY INVESTMENT. ANY PROJECTIONS, ESTIMATES, FORECASTS, TARGETS, PROSPECTS AND/OR OPINIONS EXPRESSED IN THESE MATERIALS ARE SUBJECT TO CHANGE WITHOUT NOTICE AND MAY DIFFER OR BE CONTRARY TO OPINIONS EXPRESSED BY OTHERS. ANY CHARTS PROVIDED HERE ARE FOR INFORMATIONAL PURPOSES ONLY AND SHOULD NOT BE RELIED UPON WHEN MAKING ANY INVESTMENT DECISION. CERTAIN INFORMATION CONTAINED IN HERE HAS BEEN OBTAINED FROM THIRD-PARTY SOURCES. WHILE TAKEN FROM SOURCES BELIEVED TO BE RELIABLE, I HAVE NOT INDEPENDENTLY VERIFIED SUCH INFORMATION AND MAKE NO REPRESENTATIONS ABOUT THE ENDURING ACCURACY OF THE INFORMATION. I MAY OR MAY NOT HAVE POSITIONS IN ANY STOCKS OR ASSET CLASSES MENTIONED. I HAVE NO AFFILIATION WITH ANY OF THE COMPANIES OTHER THAN EXPLICITLY MENTIONED.