

China Vows To Stimulate Economy on “All Fronts,” Will It Be Enough? - Midday Macro – 3/8/2024
China Vows To Stimulate Economy on “All Fronts,” Will It Be Enough? - Midday Macro – 3/8/2024
Color on Markets, Economy, Policy, and Geopolitics

China Vows To Stimulate Economy on “All Fronts,” Will It Be Enough?
Midday Macro – 3/8/2024
Market’s Weekly Narrative:
Equities are ending the week on a weaker note, with a reversal in price action as the initially well-received jobs report may have finally pushed things far enough into overbought conditions with notable divergencies between sector/factor performance and momentum forcing a general retreat in market exuberance. Nividia, the poster child for the current rally, is looking at a -10% reversal from new all-time highs reached this morning to where prices are now. On the week, there was a rotation in leadership, with value and low volatility outperforming momentum and growth. More defensive sectors also faired better, with Utilities and Real Estate outperforming, although the more cyclical Materials sector performed well too. Technology and Consumer Discretionary performed the worst. Treasuries were higher on the week, with the curve steepening, especially following today’s jobs report, which was a mixed bag due to negative past revisions and declining wage pressures. This increased the odds of a June rate cut and was in line with Powell's testimony before Congress, which reiterated the Fed’s view that it would be appropriate to "begin dialing back policy restraint at some point this year," but the central bank needs "greater confidence that inflation is moving sustainably toward 2%." The Fed’s Beige Book showed a mixed picture, with weaker consumer activity but better business sentiment. There was also an increased level of concern for commercial real estate, although views on credit more generally didn’t materially worsen. The ISM Services PMI showed stronger demand and activity, while employment, inventories, and prices contracted, while the S&P’s separate Service PMI reading was more positive, showing hiring expanded in February. Elsewhere, the ECB left rates unchanged, as expected, and noted, "Since the last Governing Council meeting in January, inflation has declined further,” leading the staff to lower their inflation projections. Expectations that the Bank of Japan will soon exit its negative policy rate regime rose on data overnight that showed a larger-than-expected increase in wages, as well as comments from BoJ Nakagawa that “Japan’s economy and inflation are steadily making progress toward meeting the stable 2% inflation target.”

WTI is ending the week lower; however, it is still in its multi-week range at around $78, moving above $80 several times throughout the week. Uncertainty over a Gaza ceasefire, the passing of OPEC+ voluntary cuts, the resumption of U.S. production/refining affected by adverse weather and maintenance, and a bullish inventory report, with a smaller-than-expected oil build and rapid declines in refined product stockpiles, were some of the things pushing and pulling on oil this week. Industrial metals were higher on the week, with both copper and iron ore benefiting from China's NPC working paper results that indicated greater energy and critical industry (EVs) investment. However, although Beijing’s economic goals for this year look more ambitious than those for 2023, some investors say they are not ambitious enough to get China’s economy out of its funk. We further cover this in our Deeper Dive section. The agg complex was better bid with today’s WASDE report supporting the recent rally in corn, while beans also rose on the results. Finally, the dollar was weaker on the week, with the $DXY falling below 103 on broad strength across various crosses. The Yen notably strengthened based on wage gains and a more hawkish BoJ tone.

Headlines:

Deeper Dive:
We will follow up on last week’s “Deeper Dive” China thoughts, given the conclusion of this week’s National People's Congress Two Sessions meeting. There were no surprises in Premier Li’s speech and the NPC work report, but no meaningful “bazooka” solutions were proposed to combat the current problems weighing on growth and confidence. However, the overall tone from the week seems to indicate there will be enough support to reach the 5% growth targets. The NPC work report retained a familiar supply-side bias but increasingly acknowledged inadequate demand as the main impediment to a more credible domestic growth cycle. It’s also clear the central government will play a more important role in borrowing, taking some pressure off local governments. Still, the announced 3% deficit target and 3.9 trillion yuan of special-purpose bonds are likely insufficient to achieve Beijing’s growth target alone. As a result, defense spending will play a more crucial role in driving growth, at the risk of crowding out investment elsewhere. However, the ultra-long special purpose bonds were the most positive message received by markets, as they indicated a multi-year fiscal expansion with recurring issuance of 30-year special CGBs to fund energy/grid infrastructure and critical manufacturing and technology self-sufficiency projects. Finally, Li said that the consistency of the macro policy orientation should be enhanced. This indicates Beijing may be considering directly supporting household consumption from borrowing proceeds. Beijing has said it wouldn’t do this in the past, but there is no other way to boost growth without boosting debt even more, and by now, there is an overwhelming consensus among economic advisors in favor of distributing fiscal proceeds directly to households.

*The planned issuance of special ultra-long bonds in 2024 is nearly three times the size of average sales of regular debt with such tenors in the previous three years

*The priority will be to grow manufacturing in critical areas such as EVs, batteries, and photovoltaics

*The continual drip of policy measures has yet to improve consumer confidence meaningfully

*If confidence can improve, households may increasingly spend their growing cash holding more freely
Markets have generally been unimpressed by the message delivered this week through NPC. Initially, cyclical commodities were lower while yields on the 30yr CGBs were unmoved given the growth implications announced in the report. As we highlighted, the lack of direct support for housing construction (especially low-income public housing), lack of further clarity on how to incentivize auto and housing appliance purchases, and no increased dovish rhetoric from the PBOC to support the stimulus push left the week’s results in line with expectations. Specifically, to the PBOC, a more supportive monetary policy stance is likely needed to sustain a further equity rally, absent any state-ordered buying, as the overall uncertain sentiment of investors remains. The lack of inflation-targeting commitments by the PBOC means the current deflationary cycle is not yet a priority there, despite the 3% target, which has not been attainable in the short term. Although the PBOC will likely continue to cut rates, it seems it missed an opportunity to change its forward guidance to a more credible and binding inflation target policy.

*Markets expect further easing of monetary policy to support fiscal, but any renewed RMB weakness may weigh on this

*Liquidity injections have come in larger than expected in recent months
Both property and local government debt risks were covered in the NPC work report, and there seems to be a lower tolerance for further property developer defaults. Given how much attention equity and local government debt markets have recently gotten from Beijing, which is clearly more worried about a worsening in systemic risks, it is likely that Beijing will not allow Vanke, the most recent large property developer in trouble, to fail. Public housing will be a key area where Beijing can help stabilize the property sector, but there was no indication that a more aggressive approach was in the works. In summary, there continues to be a more supportive fiscal stance coming out of Beijing, as seen in the NPC work report, especially for energy infrastructure, critical manufacturing sectors, and potentially affordable housing, but the overall tone and lack of monetary policy support in messaging disappointed markets on the week. Of course, it's unlikely China will return to its old growth model, which relied on borrowing and channeling excess savings to unproductive investments to boost GDP. As a result, the priorities are to channel capital into “sanction-proofing” the economy and defense spending, which should be around 7% of GDP in 2024. Further, the PBOC may also have a greater focus on stabilizing the RMB exchange rate following last year’s weakness, but this is debatable given the longer-term strategy to de-dollarize and also the potential for overcapacity in strategic sectors to be unloaded abroad, pushing deflation out.

*We believe a line will drawn with Vanke, as further property developer defaults and bankruptcies will impair the ability to reach this year's growth target

*FDI from the U.S has declined by -90%, largely a result of capital controls and self-sanctioning
Turning to geopolitics, there was at least some suggestion that Beijing isn’t deaf to escalating concerns in advanced economies that China’s manufacturing investments will dump capacity onto world markets, worsening trade tensions. Authorities vowed to “prevent overcapacity” in some key industries as companies suffer from squeezed profit margins after cutting prices to remain competitive. And Xi, for his part, said his fresh mantra about boosting “new productive forces” should avoid creating bubbles as officials scramble to build out new industries. However, the interdependence with the West is no longer a source of stability, moving from transactional during the Trump-era to a more ideological standoff under Biden. The U.S. policy especially has moved from a less structured “negotiating” posture to a now very aggressive economic regime change strategy. Hence, trade with the West is increasingly met with protectionism, as seen in Biden’s recent EV export worries. This forces Beijing to reduce its reliance on the West and pivot to the BRICS+, prioritizing growing market share in critical sectors. At the same time, increased defense spending, grey-zone warfare activities around China and in the South China Sea, and a lack of cooperation on the Middle East and Ukraine have worsened official relations despite what seemed like a recent reprieve in tensions. As a result, all economic participants, the government, businesses, financial institutions, and investors will have to adjust their expectations to adapt to this new normal.

*Trade with non-western nations has increased, especially with Russia

Looking forward, the PBOC will set its one-year medium-term lending facility rate next week, with markets expecting a 10bp cut as part of a coordinated policy support push. However, given that the tone on monetary policy at the Two Sessions was kept unchanged, continuing to highlight “prudent monetary policy,” the probability of a cut next week has fallen somewhat. Further, there has been a pattern of “surprise policy” announcements intended to gain more attention and shift sentiment domestically and abroad, hence getting more bang for the buck. As a result, it is unclear whether PBOC head Pan, who has been willing to take larger steps, will sharply change policy this year. Despite this risk and given the developments in the NPC work report, we maintain our long Chinese equities position. We continue to see growth recovering, driven by stronger external demand and a stabilization in domestic business and consumer confidence. We do not see a renewed private sector investment boom; instead, we see a gradual return to normalization in the property sector as less of a drag, while the prioritization of “critical” R&D and manufacturing sectors drives growth. There may also be increased levels of equity buybacks, which will align with state-sanctioned buying by SWFs and larger asset managers. The currency channels will be the biggest wild card, with stronger growth attracting capital inflows, while Beijing may prefer a weaker currency against BRICS+ trading partners to channel manufacturing overcapacity elsewhere. However, this is still to be seen. Finally, we are adding a long copper position to our mock portfolio. We will further review the reasons for this next week, but it also piggybacks on stronger growth out of China, especially due to energy and EV investments/production, as noted below by the Glencore CEO.
“Demand for copper in China last year was up between 5% and 6%. You can see it for zinc, we can see for copper, you can see for aluminum, very strong demand from China last year. And what's driving this demand? It's not a little bit, yes, it's property completions. But when you look at the other big growth pillars within the Chinese economy, it's solar installations. It's wind installations. It's battery electric vehicles. This is driving. Its grid spending, this is driving the demand for materials in China, and we see the order book strong this year again. They continue to buy materials as we transition to a low-carbon world.” - Glencore CEO Gary Nagle

*The world’s asset managers are overweight Japan and underweight China regarding Asia exposure; we believe this should correct somewhat in 2024
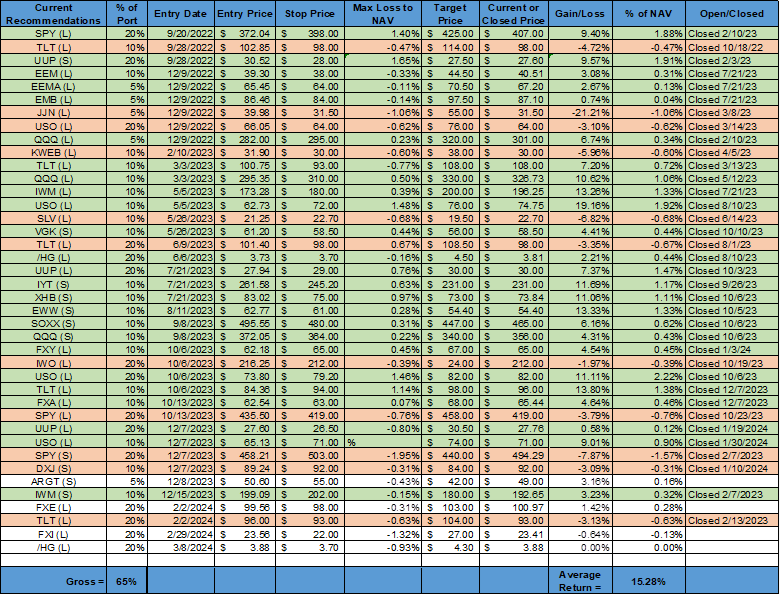
*The average return remains little changed on the week, with the addition of a long copper position heavily tying the portfolio’s returns to global growth sentiment
As always, thank you for reading, and please share our newsletter if you like it and know others who may enjoy it. Please feel free to reach out with any questions or comments. – Michael Ball, CFA, FRM
Policy Talk:
Recent rhetoric from Fed officials did not materially change the picture this last week. Powell stayed on script during his two-day Humphrey-Hawkin testimony. Powell signaled that while cuts will likely be appropriate "at some point," likely later this year, "the committee does not expect that it will be appropriate to reduce the target range until it has gained greater confidence that inflation is moving sustainably toward 2%.” Powell reiterated that the Fed believes their policy rate is likely at its peak for this tightening cycle if the economy evolves “broadly as expected.” However, the statement also stressed that the economic outlook is uncertain, and ongoing progress toward our 2 percent inflation objective is not assured. There was nothing new in Powell’s testimony that has not already been said in the January FOMC meeting statements and minutes, as well as recent speeches and interviews by other Fed officials.

Speaking at a conference in Chicago, Dallas Fed President Lorie Logan delivered prepared remarks focused on the recent experience with quantitative tightening across advanced economies. The research she reviewed showed that quantitative easing and QT effects appear asymmetric. For example, while QT announcements tend to increase government bond yields, the effect, as measured in the paper, is significantly smaller in magnitude than the typical decrease in yields associated with QE announcements. Further, while large-scale asset purchases have at times contributed to dramatic improvements in market functioning during stress episodes, QT episodes do not appear to have significantly reduced the liquidity of government bonds. Governor Waller also spoke about the same research paper on quantitative tightening that Logan did in New York, varying in his view on how the BS should look. Waller indicated he would like to see the share of Treasury holdings move towards a larger proportion of shorter-dated Treasuries, indicating a reverse “Operation Twist” may be in the cards moving forward. He would also like the holdings of MBS to fall to zero.

Minneapolis Fed President Kashkari signaled that stronger economic data since the start of the year will likely make it appropriate for the Fed to cut rates only twice, or possibly just once, this year. "It's hard to see, with the data that's come in, that I'd be saying more cuts than I had in December (when he had two cuts)," He noted the Fed still wanted to enable a soft landing where the job market stays healthy. However, he added "if the economy is doing very well, maybe the economy can sustain this rate environment when we didn't realize that was possible.” With the U.S. labor market strong and growth above trend, there isn’t pressure on the Fed to cut interest rates, Atlanta Fed President Raphael Bostic said in interviews and prepared remarks posted on the Atlanta Fed’s website titled “Three Economic Realities That Make Me Grateful Yet Vigilant.” He expects the Fed’s first interest-rate cut, which he has penciled in for the third quarter, will be followed by a pause the following meeting to assess how the policy shift is affecting the economy. “The good news is the labor market and economy are prospering, furnishing the FOMC the luxury of making policy without the pressure of urgency.” One concern about cutting interest rates is that businesses seem to be poised to “pounce” on the first hint of a move and quickly boost spending and hiring, Bostic said. “This threat of what I’ll call pent-up exuberance is a new upside risk that I think bears scrutiny in coming months,” he said. “ As my staff and I have talked to business decision-makers in recent weeks, the theme we’ve heard rings of expectant optimism.”

The Fed’s March Beige Book indicated that economic activity increased “slightly, on balance” since January, with eight districts reporting “slight to modest” growth in activity, three others reporting no change, and one reporting a “slight softening.” Consumer spending was seen as cooling, with greater price sensitivity by consumers, as consumers traded down and prioritized staples. Leisure and hospitality activities varied by district and segment, with air travel still “robust,” but hotels, restaurants, and other activities softened due to greater price sensitivity and adverse weather. Manufacturing activity was stable, and supply chains continued to normalize. Demand for residential real estate picked up due to the drop in mortgage rates, but limited inventories continued to hinder activity. Commercial real estate activity continued to be weak, especially for the office space, but demand for data centers, industrial, and manufacturing increased. Loan demand fell in some districts, and credit quality was “generally positive.” Overall, business sentiment remained generally positive, with the general assessment saying, “The outlook for future economic growth remained generally positive, with contacts noting expectations for stronger demand and less restrictive financial conditions over the next 6 to 12 months.”

Labor market tightness eased further, although employment rose slightly to a modest pace in most districts. Firms found it easier to fill open positions and to find qualified applicants, although higher-skilled labor was still harder to secure. Wages were seen increasing at a slower pace, with workers expecting more historically normal compensation raises. Price pressures were reported as persisting, but several districts reported “some degree of moderation.” Logistical and insurance costs were reported as higher, while firms had a harder time passing on price increases. However, the cost of manufacturing and construction inputs were reported as falling in recent weeks.
“The pace of input price increases picked up to a moderate pace. Contacts noted outsized increases in the prices of raw materials such as cocoa, copper, plastic, and textiles amid ongoing sharp increases in insurance and freight costs. Pricing pressures have eased for steel, paper, and grains—inputs that saw steep price increases in recent years. The pace of selling price increases remained modest for most services but picked up for manufactured goods.” – NY District
“During the period, District banks reported modest growth in home mortgages, auto loans, and commercial real estate lending. The volume of home equity lines and commercial and industrial loans were essentially flat. Credit card volumes fell significantly as consumers paid down balances that surged during the year-end holiday season. However, other consumer loans rose moderately.” – Philladelphia District
“Wage pressures were largely unchanged in recent weeks and have been relatively stable over the past year. Many firms reported that wage pressures had normalized. Notably, many manufacturing and business services firms returned to offering standard annual cost-of-living adjustments, with several noting that increases were lower than in previous years. Similarly, firms across industries reported holding wages steady as labor availability increased and retention improved.” – Cleveland District
“After declining recently from elevated levels, consumer spending stabilized over the past month. Several contacts noted a recent shift in sales across spending categories due to heightened price sensitivity among consumers. Hotels noted bookings by leisure and small-group “SMERF” customers fell, even though business and large event bookings grew robustly” KC District

*Majority of watched words trended lower

*Mentions of CRE did rise
Total consumer credit increased by 4.7% or $19.49 billion in January, following a $1.56 billion rise in the previous month and above market expectation of a $9.25 billion growth. Revolving credit increased by 7.6% on an annual basis or $8.4 billion, while nonrevolving credit increased by 3.6% or $11.1 billion.

*Total credit jumped in January after a weaker reading in December

*Real credit card debt is back to pre-pandemic highs

*Revolving debt to disposable income is still below pre-pandemic levels
U.S. Economic Data:
Total nonfarm payrolls increased by 275K in February, beating forecasts of 200K and higher than a downwardly revised 229K in January. There were significant negative revisions to December and January’s data, totaling -167K. Education and health services, followed by leisure and hospitality, were the two most significant contributors to the gains, while manufacturing was the only industry with negative gains. Government payrolls increased by 52K in February, following an upwardly revised 52K in the prior month. The unemployment rate increased by 0.2 percentage points to 3.9%, reaching the highest level since January 2022 and surpassing market expectations of 3.7%. The U6 unemployment rate increased to 7.3% in February from 7.2% in the prior month. The number of unemployed people in the household survey increased by 334K to 6.5 million. The labor force participation rate remained at 62.5% for the third consecutive month, and the employment-population ratio changed slightly to 60.1%. Average hourly earnings increased slightly by 0.1% in February, following a downwardly revised 0.5% increase in January and below market forecasts of 0.3%. The average workweek edged up by 0.1 hours to 34.3 hours, following a decline of 0.2 hours in January, which was in line with market forecasts. In manufacturing, the average workweek changed slightly, at 39.9 hours, and overtime increased by 0.2 hours to 3.0 hours in February.
Key Takeaways: Despite the stronger-than-expected headline increase in payrolls of 275K in February, the “totality” of the report was weaker. Household employment declined by 184K, the third consecutive monthly decline, and the unemployment rate rose to 3.9% from 3.7% and is now up 0.5% points from the low seen in April 2023. Further, the net downward revision of -167K to payroll growth in December and January negated the beat in February, which could always also be revised lower. Finally, the weaker average hourly earnings increase of only 0.1% in the month means real disposable income did not meaningfully increase. Private sector payrolls are now averaging around 205K over the last three months. However, in terms of where the jobs were created in February, it was yet again concentrated in government (52k), leisure & hospitality (58k), and private education & healthcare (85k), not industries you would typically associate with a strong vibrant U.S. economy. On the positive side, hours worked did rise after the weather weighed on January’s results, especially for the manufacturing sector, which saw an increase in overtime hours, too, despite a slight contraction in jobs there in February. When compared to this week’s JOLT report, there looks to be a loosening in labor markets, with the ratio of vacancies to unemployment falling to 1.37, the lowest reading since August 2021. Combined with the lower revision to Q4 ECI yesterday, the almost flat wage growth in the month should calm the Fed’s wage-spiral fears and reduce any focus on core service sector inflation stickiness, especially after a flare-up in inflation readings in January.

*Headline payroll increases continue to generally trend higher since the fall, although revisions were notable this month

*Payroll gains were concentrated in a few major industries, although the majority were positive

*The unemployment rate has now been below 4% for 25 months straight

*Average hourly earnings have been little changed on an annual basis for several months now

*The participation rate was unchanged during the month

*The household survey continues to reflect a weaker labor market outlook
The number of job openings declined by 26K to 8,863 million in January, the lowest in three months and below the market consensus of 8.9 million. During the month, job openings decreased in retail trade (-170K), government (-105K), transportation, warehousing, and utilities (-66K), in durable goods manufacturing (-48K), private educational services (-41K) and construction (-21K). On the other hand, job openings increased in nondurable goods manufacturing (+82K). Regarding regional distribution, job openings fell in the South (-12K), the Midwest (-19K), and the West (-52K) but rose in the Northeast (+58K). The number and rate of hires changed little, at 5.7 million and 3.6%, respectively, while the number of layoffs and discharges also changed little at 1.6 million, and the rate was 1.0%. Total separations were 5.3 million, and the rate was 3.4% for the third month in a row. The number and rate of quits changed little, at 3.4 million and 2.1%, respectively. The number of quits increased in information (+23K) but decreased in real estate and rental and leasing (-16K).
Key Takeaways: The lower level of openings continued the downward trend after recent strength in the last few months. More importantly, the quits rate fell further and is now trending below pre-pandemic levels. The majority of openings are concentrated in education and health services, while the majority of declines in openings came from trade, transportation, and utilities. Small firms (1 to 9 employees) still have the highest openings rate, while the quits rate is more evenly dispersed amongst various sized firms up to 1000 employees and then falls drastically into larger ones.

*After three months of stronger readings, the level of openings fell again

*The ratio of openings to unemployed moved higher

*The quits rate level keeps trending lower

*Workers are quitting less frequently than they did before the pandemic in many industries
Challenger reported announced job cuts at 84,638 in February, up from 82,307 in January. February 2024 layoff announcements are 9% higher than year-ago levels and the highest for February since 2009. Layoff announcements in February 2024 were led by transportation, technology, and services companies. So far this year, companies have announced plans to cut 166,945 jobs, down 7.6% from the 180,713 cuts announced in January and February last year. Companies primarily cite “restructuring” plans as the reason for cuts, with 37.6K cuts due to this. Another 26.2K job cuts are due to store, unit, or plant closing, while 20.9K were due to cost-cutting. In February, employers announced plans to hire 10,317 workers, for a total of 15,693 year-to-date, the lowest year-to-date total for announced hiring plans on record since Challenger began tracking hiring plans in 2009.
Key Takeaways: While the aggregate level of cuts is lower than last year, and technology and financial industries are the leading job cutters, several industries are up significantly over last year. The industrial manufacturing (up 1,754% YoY), energy (up 1,059% YoY), education (up 944% YoY), transportation (up 587% YoY), and food manufacturers (up 355% YoY) sectors are all up notably during the January and February period versus last year’s comparable period. The rise in layoff announcements stands in contrast to relatively stable jobless claims. “As we navigate the start of 2024, we’re witnessing a persistent wave of layoffs. Businesses are aggressively slashing costs and embracing technological innovations, actions that are significantly reshaping staffing needs,” stated Andrew Challenger, Senior Vice President of Challenger, Gray & Christmas, Inc. Companies have explicitly mentioned artificial intelligence as the reason for 383 job cuts so far this year. More often, they state they are updating or incorporating new technology, accounting for 15,225 cuts through February.

*Although not as bad as last year, YTD layoffs are higher than historical averages
The ISM Services PMI declined to 52.6 in February from 53.4 in January and below forecasts of 53. Activity and demand expanded at a faster rate. Business Activity (57.2 vs. 55.8) increased, with only four industries reporting a decrease in activity, while New Orders (56.1 vs. 55) also expanded faster, with only one industry reporting a decrease. The Backlog of Orders (50.3 vs. 51.4) moved to a neutral reading, while New Export Orders (51.6 vs. 56.1) also expanded at a reduced rate. Supplier Deliveries (48.9 vs. 52.4) indicated faster deliveries were reported, while Imports (54.3 vs. 59.9) expanded at a reduced rate. Inventories (47.1 vs. 49.1) contracted further, with respondents noting that better supply chain logistics allowed reduced stocks, helping also reduce Inventory Sentiment (56.7 vs. 59.3) readings, although 12 industries still saw their inventories as too high. Employment (48 vs. 50.5) moved back into contraction after a more neutral reading in January, with six industries reporting an expansion. Labor was still listed as a commodity in short supply and higher in price. Finally, Prices (58.6 vs. 64) fell notably, although the reading remained expansionary.
Key Takeaways: February’s reports headline reading indicated that activity slowed more than expected, but this was due to faster supplier deliveries and the contraction in the Employment Index. New demand and activity measures continued to expand at a faster pace, with the majority of respondents “mostly positive about business conditions.” There was a marked slowing in input prices, a welcome sign for Fed officials. The decline in the employment index to below 50 is notable but has not coordinated well with NFP results, as the index stood at 43.8 in December, but private services employment grew by 129K that month. There was also a more even split between industries increasing and decreasing hiring. However, in “totality,” the decline in employment and price readings are more consistent with further progress on disinflation, which is encouraging for the case for a rate cut in June.

*The headline index was lower, although the sub-index readings were more mixed

*Both employment and price measures fell, a welcome sign for the Fed

*Every sub-index reading contracted other than production and new orders
New orders of manufactured goods declined by -3.6% in January, following a revised 0.3% decrease in December, compared with market forecasts of a -2.9% decline. Excluding transports, new orders declined by -0.8% MoM (vs. -0.3% MoM in Dec), with transportation equipment lower by -16.2% MoM (vs. -0.6% MoM). However, motor vehicles were higher by 0.7% MoM (vs. 0.3% MoM). There was weakness in furniture (-2.2% MoM vs. -0;8% MoM), primary metals (-1.9% MoM vs. 0.3% MoM), fabricated metal products (-0.9% vs. 0.1% MoM), and machinery (-0.3% MoM vs. -0.4% MoM). However, construction machinery (0.2% MoM vs. -3.1% MoM) was more stable, while mining equipment (-1.7% MoM vs. 8.6% MoM) and industrial machinery (-4.6% MoM vs. -1.9% MoM) were weaker. On the other hand, computers and electronic products (1.3% MoM vs. 0.1% MoM) and electrical equipment (0.9% MoM vs. 0.1% MoM) were all stronger. Total shipments declined by -1.0% in January, following a decline of -0.5% MoM in the prior month. Excluding transports, shipments declined by -0.6% MoM. Total unfilled orders increased by 0.2% MoM, declining from a 1.3% MoM increase in the prior month. Finally, total inventories declined by -0.1% MoM, after being unchanged in December.
Key Takeaways: The totality of the report showed a weaker picture, but given the weight of weather on all data in January and the lack of Boeing orders, it is a little bit of a messy reading overall. The increase in electronics and electrical equipment negated the weakness seen in machinery. The large decline in furniture orders is worth watching, given the expectations for housing to be a more positive factor for growth. Although aircraft orders fell notably, the persistence in auto orders showed the continuation of normalization of supply there. Orders for non-defense capital goods, excluding aircraft, a measure of business spending plans on equipment, were unchanged in January instead of gaining 0.1% as estimated. Shipments of these so-called core capital goods increased by 0.9%.

*Factory orders came in weaker than expected in January due to weather and Boeing
Technicals, Positioning, and Charts:
The S&P outperformed the Russell and Nasdaq on the week. Utilities, Materials, and Real Estate were the best-performing sectors, while Value, High Dividend Yield, and Low Volatility were the best-performing factors. Mid-cap value was the best-performing size/value combo of the week.

@Koyfin
S&P optionality strike levels have the Zero-Gamma Level at 5089 while the Call Wall is 5200 and the Put Wall is 4800. Spotgamma sees 0DTE order flow as a large (or main) driver in the midweek rally, a sign that trading is on momentum, and the associated move is more prone to reversal, which is what is occurring today. Also, the SPY Call Wall remains at 515, and the fact that it did not roll higher suggests a lack of call activity overhead. More generally, call skews are flattening, which results in a reduction in bullish exuberance. As a result, the bull trade here could be losing momentum, and the target area for that to really take shape is next week, into CPI and March OPEX. This is followed by a heavily anticipated NVDA event (3/18), and 3/20 VIX Exp.

@spotgamma
S&P (/ES Futures) technical levels have support at 5105, then 5060, with resistance at 5160, then 5190

@AdamMancini4
Treasuries are flat on the day, with the 10yr yield around 4.08%, while the 5s30s curve is steeper by 3.5 bps on the session, moving to 20 bps.

Four Key Macro House Charts:

Growth/Value Ratio: Value is higher on the week; with Mid-Cap Value the best-performing size/factor on the week.

Chinese Iron Ore Future Price: Iron Ore futures are higher on the week.

5yr-30yr Treasury Spread: The curve is steeper on the week.

EUR/JPY FX Cross: The Yen is stronger on the week.
Other Charts:

AAII bullish sentiment improved to the highest (51.7%) since December 20 - AAII

"Single stock option volume in calls (betting on stocks to go up) has recently risen sharply. It’s still nowhere near the heights reached during the meme stock bubble." - @johnauthers
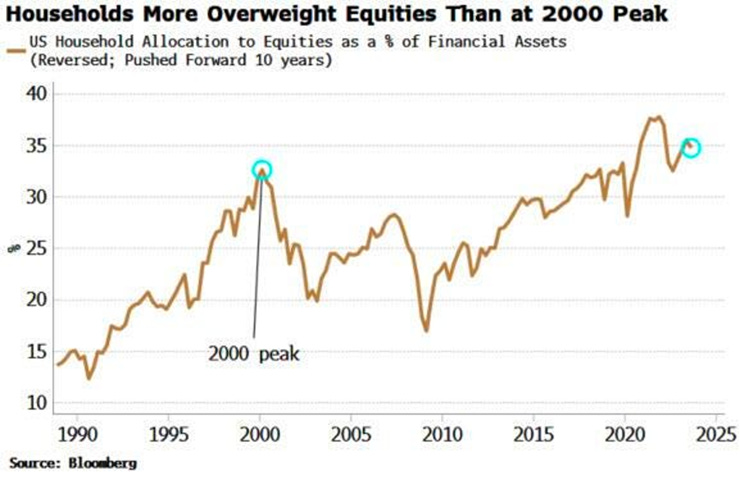
"The household sector in the US is more invested in equities, relative to its total holdings in financial assets, than it was in 2000." - Simon White, Bloomberg

"Today’s multiple of 25x normalized earnings implies +2.6%/yr annualized returns over the next decade based on the historical relationship." - Savita Subramanian – BofA

Valuations have been the main driver of US equity outperformance relative to other DMs over the past year or so. - @DailyShot

Analysts are very optimistic about US tech sector earnings growth. - @DailyShot

Buyback activity so far this year has been in line with last year's when adjusting for the large one-time massive buyback by Chevron.

“JPM makes an interesting observation: "We note that the multiple for the S&P 400 (mid-caps) relative to the S&P 500 is at its lowest level on record." Even with mid-caps up 8 weeks in a row... h/t JP Morgan” - @DayHagan_Invest

Price at the pump continues to rise as production was impacted by bad weather, and inventories are near average levels, while implied demand is rising.

The Manheim Used Vehicle Value Index fell 0.1% MoM in February to -13.1% YoY, but the last week of the month saw "some of the strongest weekly gains in wholesale prices for many years." – Daily Chartbook


Companies are increasingly reliant on foreign-born workers to meet their staffing needs (2 charts). - @DailyShot

On aggregate, global central banks continue to ease policy despite some signs that inflaiton has been more sticky than expected.

"In January, central banks reported that they increased global official gold reserves by 39t. This was more than double the (revised) December net purchases of 17t, and the eighth consecutive month of net purchases." – World Gold Counsil
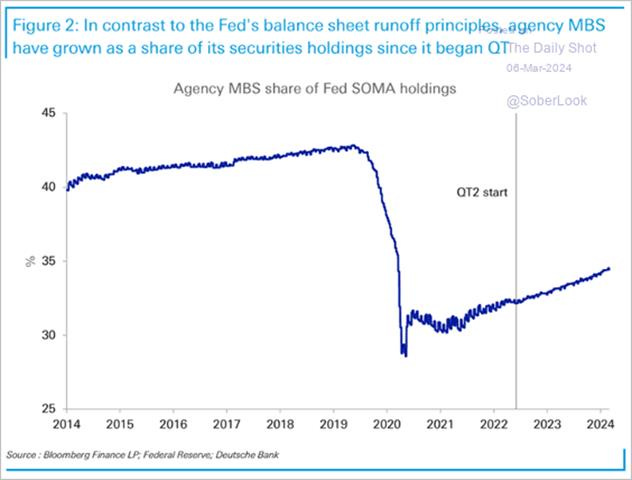
The Fed’s balance sheet reduction of its Mortgage-Backed Securities holdings has been sluggish due to a spike in mortgage rates that stifled refinancing activities. Consequently, MBS now constitute a larger share of the central bank’s securities portfolio. - @DailyShot

The NY Fed’s latest estimate of R*, now at its lowest in a decade, …

… alongside the highest real fed funds rate since before the financial crisis, points to exceptionally tight current monetary policy. - @DailyShot Bloomberg

The market also sees the Fed’s policy as tight. This chart shows the market expectations of the long-run nominal fed funds rate running well below the current policy rate. - @DailyShot
Articles by Macro Themes:
Medium-term Themes:
China’s Rebalancing Act:
Vanke: At least two Beijing-based insurers that farmed out annuity investments late last week told their external portfolio managers to closely monitor Vanke’s credit risks. One life insurer also told its pension managers to curb exposure.Meanwhile, Vanke, China’s second-biggest developer by sales, started a new round of negotiations with state insurers to extend maturities of some private borrowings. Vanke is the latest developer to face scrutiny from investors and creditors, following defaults by Country Garden Holdings and China Evergrande Group. Vanke is one of the few large property developers in China that has not defaulted and is seen as a bellwether for the government’s support of the sector. - Chinese insurers sound the alarm over Vanke debt risks after property giant’s bonds, shares tumble on repayment concerns - SCMP

Surge: China’s exports started the year on strong footing, offering a possible pathway for Beijing to hit its aggressive growth target this year while raising the likelihood of increased trade tensions. China’s outbound shipments rose 7.1% in the January-February period when compared with a year earlier, accelerating from a 2.3% increase in December, according to data released Thursday by Beijing’s General Administration of Customs. At their press briefing on Wednesday, Chinese officials paired their early release of the official data with a warning that the export data would likely soften in March. They also hinted at monetary-easing moves to keep Beijing on track to realizing the growth target that officials unveiled on Tuesday. - China’s Exports Rise, Cheering Beijing—and Foreshadowing a Backlash – WSJ

Longer-term Themes:
The Singularity is Near (AI Developments) and Cyber Life (More Generally):
Reauthorize: The Biden administration will ask a court to renew the certification necessary to collect intelligence under Section 702 of the Foreign Intelligence Surveillance Act (FISA), a Justice Department official said. The program, set to expire in April, allows the government to spy on noncitizens located abroad without a warrant, a practice that sweeps up Americans’ data without a warrant in the process. Congress must reauthorize the program, but the Justice Department’s imminent request to the Foreign Intelligence Surveillance Court would avoid a “dangerous gap in collection” of intelligence, according to Assistant Attorney General for National Security Matthew Olsen. The request is consistent with the DOJ’s “standard annual practice,” he said in a statement. - U.S. to Ask Court to Reauthorize Disputed Surveillance Program for a Year - NYT
The Demise of Unipolarity: A World of Rising Regional Sphere:
Global Ambitions: The Kremlin is steadily making diplomatic inroads in Africa at a time when the rich democracies are trying to isolate Putin’s regime. A number of African leaders have highlighted Soviet-era relations as they have moved to downgrade ties with the West. Several bumper harvests have left Russia with a glut of grain, some of which it’s donating to nations marred by instability. During the Russia-Africa summit last year, Putin promised up to 50,000 tons of free grain each for Burkina Faso, Zimbabwe, Mali, Somalia, Central African Republic, and Eritrea. The Russian Agriculture Ministry said this week that 200,000 tons of “humanitarian aid for Africa” have so far been delivered. What Russia gets in return is support for its ambitions and access to markets that can potentially soften some more of the impact of US and European sanctions. - Russia Ships Free Grain to Africa to Reward Geopolitical Allies - Bloomberg

New Friends: Vladimir Putin’s war against Ukraine has already had economic costs for South Korea. Many South Korean companies, such as Hyundai, had to withdraw from the Russian market or abandon investments there as part of international sanctions against the Putin regime. But the war also is having military and security implications for South Korea. The North Korean regime has sent 6,700 shipping containers or war materiel to Russia following the September summit between Vladimir Putin and Kim Jong-un. In return, Russia appears to be sending North Korea not only food and other necessities, but also raw materials and parts used in weapons manufacturing. These steps will improve North Korea’s defense industries and help modernize its rocket and missile programs. Moscow also may have provided satellite-related technology to support Pyongyang’s launch of its first spy satellite into orbit in November. - The JoongAng-CSIS Forum 2024: Keynote Address by Matt Pottinger - CSIS
Food: Security, Innovations, and Climate Change Implications:
Stress Testing: The combined forces of El Niño and La Niña have crippled Latin American soy output. Ukrainian and Russian grain farmers have gone to war. Indonesia has banned shipments of palm oil to Europe, while China is hungry for crops. The Mediterranean region is getting more like a desert. Over two days in central Brussels last month, some 60 European Union and government officials, food security experts, industry representatives and a few journalists gathered to confront the possibility of something barely on the radar a few years ago: a full-blown food crisis. To watch one of the best-fed regions in the world stress test its food system underscores a growing level of alarm among governments over securing supplies for their populations. - Europe Is Wargaming a Food Crisis - Bloomberg

Cold Places (Deep Sea, Artic, and Space Capitalization):
Cutting Cables: Mysterious damage to vital communications cables under the Red Sea has raised concerns about whether the conflict in the Middle East is now beginning to threaten the global internet. What disabled the cables is still not clear. Suspicion has centered on Yemen’s Houthi rebels, but the Houthis, who have attacked numerous ships in the area in what they say is solidarity with Palestinians in Gaza during the war between Israel and Hamas, have denied responsibility. Arranging repairs is proving difficult. Seacom is working with a company called E-marine, which has boats in nearby Oman, to address the problem, but Mr. Padayeechee acknowledged that the job requires assessing the political situation and obtaining permits from Yemen. - Damage to Cables Under Red Sea Highlights Mideast Conflict’s Broader Threat - NYT

Serious Considerations: The head of Russia’s space agency said it’s working on plans with China on ways to deliver and install a nuclear power plant on the moon by 2035. In 2021, Russia and China presented a road map for building a scientific station on the moon by the end of 2035. According to a Tass news service report, the plan for the project includes technical lunar rovers for research, a jumping robot and several smart mini-rovers designed to explore the surface of Earth’s satellite. There is precedent for using nuclear power in space missions and in other remote areas on Earth. The US has used plutonium-238, which has a favorable half-life, as a power source for computers, scientific instruments and other hardware on more than two dozen space missions, according to NASA, while Russia has used other radioactive material to power remote lighthouses and nuclear submarines. - Russia Says Working With China for Lunar Nuclear Power Plant - Bloomberg

Automated Warfare:
On The Seabed: The Ukrainian military said Tuesday it had sunk yet another Russian warship in the Black Sea, this time the patrol ship Sergey Kotov. Kyiv has already put nearly a third of Moscow’s Black Sea fleet on the ocean floor, and they’ve done it by relying heavily on drones. Not just the airborne ones you’ve heard plenty about but also unmanned waterborne drones. These deadly and relatively inexpensive weapons have helped Ukraine to even the seascape against a much larger enemy. Consider that the cutting-edge Sergey Kotov was worth roughly $65 million. The jetski-powered MAGURA V5 kamikaze drone that destroyed it cost about $250,000. You do the math. In less than a year, these drones had already knocked off a missile corvette and two landing ships. - Kyiv says seven dead as drone attack sinks Russian ship - BBC

Other Articles of Interest:
Loopholes: U.S. lawmakers are calling for a crackdown on the special trade provision that e-commerce juggernauts Temu and Shein are using to flood the country with cheap imports. The shipments using the de minimis rule are surging this year, the WSJ’s Richard Vanderford reports, with at least 485 million packages entering the U.S. so far this fiscal year after 685 million packages were counted in the entire previous fiscal year. The customs provision allows packages with contents under $800 in value to enter the country duty free under a simplified procedure. Critics say that is helping companies sidestep tariffs and defy bans on imported goods made with forced labor. - Imports Under Closely Watched U.S. Trade ‘Loophole’ Surge – WSJ

Global: When Lt. Gen. Abdel Fattah al-Burhan, Sudan’s military ruler, found himself besieged by rebel forces in the country’s capital last summer, he called an unlikely ally for help: Ukrainian President Volodymyr Zelensky. Within a few weeks of the call, Ukrainian commandos landed in Sudan and began fighting to push the rebel forces out of the capital, Khartoum, according to several Ukrainian soldiers involved in the operation. With fighting in Ukraine at a near stalemate, a global battle over weapons and economic resources is taking shape, as both sides dig in for a war that could last many more years. - Ukraine Is Now Fighting Russia in Sudan – WSJ

Grey-Zoning: China steps up gray-zone warfare to exhaust Taiwan, defense report says: China has stepped up gray-zone warfare against Taiwan, aiming to make the areas around the democratic island “saturated” with balloons, drones, and civilian boats, a Taiwan defense ministry report said today. The report also said Beijing has launched “multi-front saturated gray-zone” tactics to harass Taiwan, including increased patrols of ships and planes. China has attempted to “increase burdens of our naval and air forces and to obscure the existence of the median line in the strait.” It added China has also incorporated research and militia vessels in a move to “disguise military activities with civilians.” - China steps up grey-zone warfare to exhaust Taiwan, defence report says - Reuters

Podcasts and Videos:
VIEWS EXPRESSED IN “CONTENT” ON THIS WEBSITE OR POSTED IN SOCIAL MEDIA AND OTHER PLATFORMS (COLLECTIVELY, “CONTENT DISTRIBUTION OUTLETS”) ARE MY OWN. THE POSTS ARE NOT DIRECTED TO ANY INVESTORS OR POTENTIAL INVESTORS AND DO NOT CONSTITUTE AN OFFER TO SELL -- OR A SOLICITATION OF AN OFFER TO BUY -- ANY SECURITIES AND MAY NOT BE USED OR RELIED UPON IN EVALUATING THE MERITS OF ANY INVESTMENT.THE CONTENT SHOULD NOT BE CONSTRUED AS OR RELIED UPON IN ANY MANNER AS INVESTMENT, LEGAL, TAX, OR OTHER ADVICE. YOU SHOULD CONSULT YOUR OWN ADVISERS AS TO LEGAL, BUSINESS, TAX, AND OTHER RELATED MATTERS CONCERNING ANY INVESTMENT. ANY PROJECTIONS, ESTIMATES, FORECASTS, TARGETS, PROSPECTS AND/OR OPINIONS EXPRESSED IN THESE MATERIALS ARE SUBJECT TO CHANGE WITHOUT NOTICE AND MAY DIFFER OR BE CONTRARY TO OPINIONS EXPRESSED BY OTHERS. ANY CHARTS PROVIDED HERE ARE FOR INFORMATIONAL PURPOSES ONLY, AND SHOULD NOT BE RELIED UPON WHEN MAKING ANY INVESTMENT DECISION. CERTAIN INFORMATION CONTAINED IN HERE HAS BEEN OBTAINED FROM THIRD-PARTY SOURCES. WHILE TAKEN FROM SOURCES BELIEVED TO BE RELIABLE, I HAVE NOT INDEPENDENTLY VERIFIED SUCH INFORMATION AND MAKE NO REPRESENTATIONS ABOUT THE ENDURING ACCURACY OF THE INFORMATION. I MAY OR MAY NOT HAVE POSITIONS IN ANY STOCKS OR ASSET CLASSES MENTIONED. I HAVE NO AFFILIATION WITH ANY OF THE COMPANIES OTHER THAN EXPLICITLY MENTIONED.