


Central Banks are Talking Tough, but Inflation is Falling, Reducing Need for Tighter Policy and Keeping Risk Assets Rallying. Can it Last? – Midday Macro - 6/16/2023
Color on Markets, Economy, Policy, and Geopolitics

Central Banks are Talking Tough, but Inflation is Falling, Reducing Need for Tighter Policy and Keeping Risk Assets Rallying. Can it Last? – Midday Macro - 6/16/2023
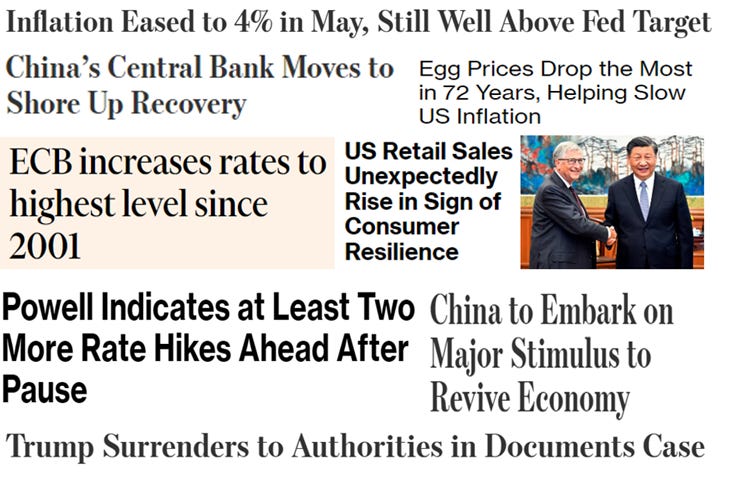
Daily/Weekly Price Action and Headlines:
Equities are lower on the day but higher on the week, with a mix of leadership today but tech and consumer discretionary sectors outperforming on the week, as an inline CPI report, not so “hawkish” Fed pause, and flat retail sales didn’t provide much clarity on future growth and policy
Treasuries are lower on the day and week, with yields continuing to trend higher but the curve flattening while the MOVE index dropped notably given reduced policy uncertainty from the Fed but a realization that the time at the terminal rate may be longer
Oil is higher on the day and the week, despite a greater build in crude inventories on the week, increased production domestically, and no new OPEC+ rhetoric; however, increased levels of expected stimulus in China and no new headlines on JCPOA 2.0 helped induce a $5 rally off recent lows
Market’s Weekly Narrative:
The S&P is ending the week slightly off its recent highs, now at levels last seen when the Fed started its policy tightening cycle on what is looking like the largest notional-sized OPEX Friday ever. With that aggressive tightening cycle now ending, as seen in the week’s “skip” at the June FOMC meeting, it is unclear how heavy the cumulative effects of the tighter policy will weigh on the real economy due to “uncertain variable lags,” the phrase of the year, according to both policymakers and markets. As a result, the recent rally looks to be more FOMO driven now. However, the breadth and level of investor participation have expanded as volatility has fallen, while optionality has skewed more positively, and technicals have become more bullish. Unfortunately, the economic data continues to signal a below period of growth is upon us, with this week’s retail sales and industrial production reports being lackluster. However, an unexpected uptick in consumer sentiment today and continued progress in inflation readings (PPI, Export/Import Prices, and to a lesser degree CPI) show we are far from recessionary conditions and likely won’t require much more policy tightening. The bear flattening of the yield curve would support that notion, with yields higher this week due to higher-for-longer signaling from the Fed and other central banks while growth uncertainty still remains high. Oil did get a well-needed relief rally this week, mainly based on China stimulus hopes, as they remain the marginal buyer in the face of higher-than-need spot supply. Copper and other industrial metals seconded this, trending higher even in the face of this week's cooling economic data in China. The agg complex also took a leg higher, with grains and beans breaking out on weather worries and Russia’s threat to end the grain corridor. Finally, the dollar had a rough week as the hawkish skip fell flat while the ECB and other central banks are looking more inclined to keep tightening. The $DXY ended the week a little over 102, with the euro cross now at 1.10, close to last year’s highs.
Deeper Dive:
The Fed opted to buy itself time this week by “skipping” a rate hike in June and keeping the dreams of a soft landing alive. Although the statement and new economic projections were meant to project a hawkish tone, Powell’s further acknowledgment of how uncertain the current situation was for policymakers in his Q&A had the opposite effect. As a result, the melt-up in equities continues even in the face of higher yields and no substantial improvement in the earnings picture. Despite the skip, time still equates to the real Fed fund rate rising as headline inflation continues to trend lower, and the Fed’s balance sheet shrinks, tightening financial and liquidity conditions. As a result, even with no further rate hikes the stance of policy only becomes more restrictive until mid-2024, when the FOMC forecasts it will begin cutting rates. This increasing policy headwind and further evidence that we are entering a below-trend period of growth, as seen in this week’s retail sales data, which lowered expected Q2 GDP growth, as the Atlanta Fed’s GDPNow’s projected Q2 real personal consumption expenditure forecast is now 0.9%, a notable drop from Q1. This doesn’t bode well for the current increasingly “FOMO greed-induced” rally in equities. Of course, with equities and credit rallying, volatility trending lower (increasingly now for rates), and the dollar weaker, one can argue that financial conditions are loosening, supporting the better breadth of the rally and greater level of participation. We take the other side at current levels, and although we called for a further melt-up in last week’s writing following the June FOMC meeting and May CPI data, we cannot get excited about entering any new nondefensive positions. As a result, we are moving our stops higher for our EM, oil, and Russell longs. We caution readers not to get too greedy here as fundamentals are still challenging despite more positive optionality and technicals. If the greatly awaited sub-par period of lower growth is finally starting and likely only hitting its fullest during Q1 ’24, earning revisions will trend lower again, and higher real rates, due to a Fed staying at a higher terminal rate for longer, will increasingly weigh on multiple expansion, the main driver of the current rally, moving forward. We will leave it there this week for our “Deeper Dive” section. We encourage readers to review our policy and econ data sections in today's newsletter as it delves further into our takeaways from this week’s FOMC meeting and economic data reports.

*The S&P has regained all its post-first Fed hike losses, but the cumulative effect of this policy tightening is increasingly now hitting the real economy due to “long and variable” lags, creating a highly uncertain growth outlook picture

*The recent rally has characteristics that make its sustainability questionable, as call skew and leadership can quickly change

*Rising real rates have done little to stem increases in growth and tech/consumer discretionary leadership, but we are doubtful that this can continue so unabated

*There has been a slight uptick in earning expectations, but multiples-expansion, specifically in a few mega-cap names, has been the primary driver of index performance

*With TGA being built back up and QT still occurring, we believe Fed liquidity measures will resume a tightening trend into next year

*A lower trending level of retail sales will likely continue due to tighter credit conditions, and extrapolating this more broadly onto the service sector means the pandemic-era stimulus-induced sugar-high level of consumer spending is ending
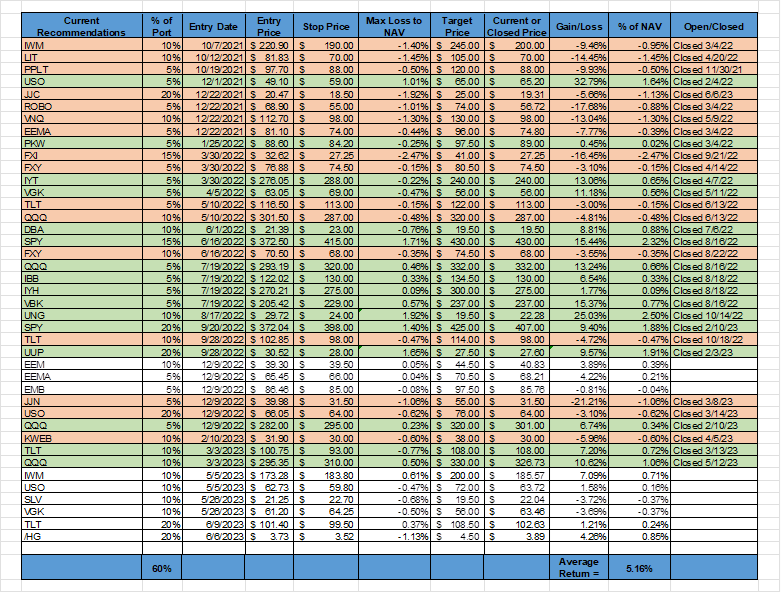
*Due to the discontinuation of the $JJC Copper ETN, we replaced that position with the continuous future contract for copper (/HG) as we still want to be long there. Otherwise, the majority of our longs have benefited from the recent rally, while shorts on silver and European stocks have incurred losses. Again, we moved up many of our stop levels as we increasingly question the durability of the current risk-on climate
We want to encourage readers to share our newsletter if they like it. We continue to gain subscribers and are encouraged to keep going and do more with each new reader we get.
Thank you for reading! - Mike Ball
Policy Talk:
The Federal Reserve left interest rates unchanged for the first time since March last year at their June FOMC Meeting, keeping the Fed funds target range at 5%-5.25%. The Fed said, "Holding the target range steady at this meeting allows the Committee to assess additional information and its implications for monetary policy" and repeated, "In determining the extent of additional policy firming that may be appropriate to return inflation to 2% over time, the Committee will take into account the cumulative tightening of monetary policy, the lags with which monetary policy affects economic activity and inflation, and economic and financial developments." The vote to hold rates steady was unanimous.

*A historical level of rate rises in a short period of time looks to be finally ending

*Changes to the official statement did not reflect much of a change in the assessment of economic conditions or inflation
The FOMC raised its year-end Fed funds forecast in its new Summary of Economic Projections by 50 bps to 5.6% from 5.1%, giving the pause a more hawkish tilt (along with its upgraded assessment of the economy into year-end), something reiterated by Powell in his press conference, who stressed the July FOMC meeting is very much “live.” Year-end forecasts for core PCE also rose to 3.9% from 3.6%, while headline PCE fell to 3.2% from 3.3%. Further, the expected change in GDP for 2023 was raised to 1% from 0.4%, while it was slightly lowered for ’24 and ’25. The expected year-end unemployment rate was lowered to 4.1% from 4.5%, and little changed in ’24 and ’25. There were no changes to any longer-run projections. The SEPs r* remained at 2.5%; however, there was an upward shift in the dots there, but not enough to raise the median.

*The year-end gap between where Fed funds will be based on market-derived pricing verse the dot plot has narrowed for year-end but remains near 100 bps for 2024.

*The SEPs projection upgraded economic growth notably through higher expected GPD growth on the year and a lower UER, supporting the higher projected core PCE and Fed funds levels
Powell’s opening press conference statement and subsequent comments as expected stressed the importance of price stability. Still, given the significant level of policy tightening and uncertain variable lags in which it affects the economy, “the committee deemed it appropriate to leave rates unchanged at the June meeting while continuing to reduce securities holdings.” He quickly went on to stress that further rate increases would be appropriate. However, in our view, with “participants” seeing subdued growth continuing and “signs” labor markets are coming into better balance, the meeting-to-meeting approach now in place will be increasingly two-sided in its risk assessment.

*There was a 50% probability for a July rate hike following Powell’s June press conference

*Policy will become increasingly restrictive throughout 2024, even with the officially projected rate cuts
In combination, the weight forward guidance has already had on the real economy, the increasingly hitting (with long and variable lags) cumulative effects of the now 500 bps of rate increases, a QT program that will be methodically draining excess reserves along with the refilling of the TGA (which should also drain some reserves or at least reshuffle money out of the RRP facility), and continued tightening in credit conditions, has the proxy Fed funds rate in now notably restrictive territory for an inflation pulse that we view as still mainly supply-side cost-push driven. As a result, the FOMC is buying time and leaning more neutral despite posturing more Hawkish with the new SEPs levels. This was made clear by Powell’s acknowledgment that the continued decline in inflation would methodically increase the real Fed funds rate without any further hikes. No one wants to be Arthur Burns, but no one wants to go full Volcker if it's not truly needed, and in our humble opinion, inflation expectations are not unanchored. Further, the stickier parts of inflation are slowly becoming unstuck, increasing the risk that core-service ex-shelter can fall relatively quickly as demand falls further in the second half of the year as labor markets loosen further right as excess saving levels finally normalize.
“We didn't make any decision about going forward, including what would happen at the next meeting, including we did not decide or really discuss anything about going to an every other meeting kind of an approach or really any other approach. We really were focused on what to do at this meeting.”
“That leaves… PCE inflation, that's not housing services. And, you know, we see only the earliest signs of disinflation there... It's a very broad and diverse sector. I would say in a number of the parts of that sector, the largest cost would be wage cost... And I think many analysts would say that the key to getting inflation down there is to have a continuing loosening in labor market conditions, which we have seen.”
“It's one of the main reasons why it makes sense to go at a slightly more moderate pace now as we seek that ultimate – I can't point to that ultimate endpoint. I can't point to a specific data point. I think we'll see it when we see inflation, you know, really, really flattening out reliably and then starting to soften. I think we'll know that we're, that it's working, and ideally, by taking a little more time, we won't go well past the level where we need to go.”
“So wages will continue to increase. So we know what we're talking about is having wage increases still at a very strong level, but at a level that's consistent with 2 percent inflation over time. And so I think we've seen some progress on all of the major measures of wages have moved down from extremely elevated, highly elevated levels a year or so ago, and they're moving back down, but quite gradually. And, you know, we want to see that process continue gradually.” - Powell

The NY Fed’s Survey of Consumer Expectations for May showed that inflation expectations declined by 0.3% MoM at the one-year-ahead horizon, their lowest level in two years, while they increased by 0.1% MoM for the three- and five-year-ahead expectations to 3% and 2.7%, respectively. Inflation uncertainty (the uncertainty expressed regarding future inflation outcomes) declined across all three horizons. Expectations for home price appreciation increased for the fourth consecutive month from 2.5% in April to 2.6% in May, the highest reading since July 2022. After staying unchanged at 3.0% for five consecutive months, the expected earnings growth declined to 2.8%. Expectations for unemployment to rise decreased by 1.8 percentage points to 40.0%, correlating with a 1.3 percentage point drop in the perceived probability of losing one's job in the next 12 months, decreasing the overall probability to 10.9%, the lowest reading since April 2022 and only 0.1 percentage point above the series low. The probability of leaving one’s job voluntarily in the next year decreased as well, by 0.5 percentage points, to 19.1%, while the probability of finding a job increased from 55.2% in April to 56.4% in May. The expected growth in household income increased slightly to 3.3%, while spending growth expectations rebounded to 5.6% in May from 5.2% in April to 5.6%. Both remained below their one-year average levels. Perceptions of credit access compared to a year ago deteriorated slightly in May. The perceived probability of missing a minimum debt payment over the next three months increased slightly to 11.3%. Households' views on their current financial situations deteriorated in May. Similarly, year-ahead expectations deteriorated, too.
Why it Matters: Although a further drop in the one-year ahead inflation outlook will be seen as a positive by Fed officials, it is somewhat negated by increases in the longer-term ones, indicating a slight de-anchoring of inflation expectations occurred in the May report. Of course, the three and five-year-ahead inflation expectations remain in their recent range. Nonetheless, it is certainly worth watching as Fed officials have continually cited well-anchored expectations as diminishing the risk of the Fed losing credibility. Elsewhere the report showed consumers still expect a strong jobs market in a year but slightly reduced expectations for incomes to increase. Households reported it was more difficult to obtain credit now than a year ago. Similarly, respondents’ views about future credit availability deteriorated slightly. Finally, the share of respondents expecting tighter credit conditions a year from now increased. Respondents below the age of 40 with no more than a high school education and those with a household income below $50k had the most negative responses.

*Inflation expectations continue to trend lower, giving the Fed comfort that things are still “anchored”

*Household spending growth rebounded slightly but remained in a downward trend

*Respondents are not yet concerned about losing their jobs
Econ Data:
Consumer prices rose by 0.1% in May, easing from a 0.4% MoM increase in April and slightly below the market consensus of a 0.2% MoM gain. This moved the annual rate to 4% from 4.9% YoY in April. Core CPI rose by 0.4% MoM, the same rate it rose at in April and March, and matching market expectations. Year-on-year, core consumer prices are higher by 5.3% in May, falling from a 5.5% YoY rise in April. The energy components of CPI were the major reason for the weaker headline reading, broadly falling -3.6% MoM, compared to a 0.6% MoM gain in April, as gasoline (-5.6% MoM), fuel oil (-7.7% MoM), and energy service (-1.1%) all declined. Food costs increased 0.2% MoM, after being unchanged in the previous two months, with prices for food at home rising 0.1% MoM and those for food away from home increased by 0.5% MoM. Shelter costs increased by 0.6% MoM, following a 0.4% MoM rising in April, with rents and OER both rising by 0.5% MoM, little changed from April, while lodging away from home (1.8% MoM) rebound after being negative last report. Core goods were higher by 0.6% MoM, mainly due to an increase in used cars (4.4% MoM), the same rate it rose in April. Elsewhere in goods, household furnishings and supplies (-0.4% MoM) and new cars (-0.2% MoM) were lower, while apparel rose by 0.3% MoM for a second month. Core services rose by 0.4% MoM for the third month in a row. Transportation costs (0.8% MoM) were higher again after falling in April due to increases in insurance costs (2% MoM); however, airline fares (-3% MoM) fell again. Finally, medical care services (0.1% MoM) were lower by the same amount for the third month.
Why it Matters: Besides the topline stickiness of monthly core CPI gains at 0.4% MoM, the overall report when removing shelter and used cars showed a generally flat acceleration of inflation. We expect both to be less persistent in the coming months as the Manheim Used Car Index has shown prices falling again. Further, Powell said he expects shelter inflation to become increasingly weaker, given what the Fed sees in prices dropping for new lease signings and home sales. However, pressure on core still came from transportation services, although the fall in airfare costs somewhat countered the rise in auto insurance. Inflation for food away from home is staying persistently higher. When coupled with comments from higher-end restaurant chains (Cheesecake Factory), it looks like upper-income consumers have altered behavior to include more eating out, giving restaurants greater pricing power even as lower-income ones (Cracker Barrell) report lower activity. Finally, the Median, Trimmed-Mean, and Sticky CPI Indexes all fell on the month and finally look to have peaked. On a three-month annualized basis, various measures of inflation are notably falling, indicating that the stickiness narrative implored by the Hawks is running its course.

*Energy tends to lead the way regarding overall inflation trends, and we take comfort in the secondary deflationary effects that should be coming

*Supercore CPI continues to trend lower, giving the Fed comfort that inflation is less ingrained

*There have been broader progress in CPI components decelerating, although pockets of uptick occurred for used cars, other goods, and lodging away from home in May

*The Cleveland Fed Median and 16% Trimmed-Mean CPI measure increased by 0.4% and 0.2% in May, respectively, moving their annualized level to 6.7% and 5.5%, respectively
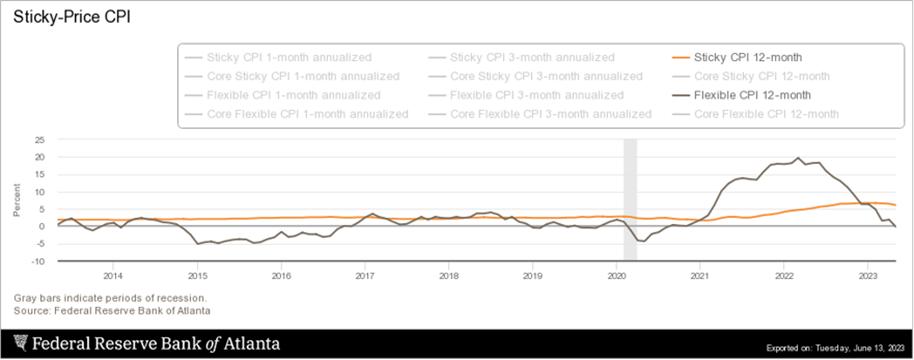
*The Atlanta Fed's sticky-price consumer price index, a weighted basket of items that change price relatively slowly, increased 4.1% YoY in May, following a 4.7% increase in April

*Three-month annualized trends continue to move in the right direction broadly
Headline Producer prices decreased -0.3% in May, following a 0.2% rise in April, and compared to market forecasts of a -0.1% drop. Year-on-year, producer prices are now higher by 1.1%, the lowest level since December 2020. Core producer prices increased by 0.2% in May, matching market estimates and the same pace as the previous month. Year-on-year, core producer prices are now higher by 2.8%, the lowest since February 2021. Food prices declined by -1.3%, while energy prices plunged by -6.8%. These decreases weighed on finished goods prices which fell by -1.7% MoM, the largest decrease since July 2022, mainly due to a -13.8% drop in gasoline prices and the fall in food. However, core finished goods PPI rose 0.3% MoM. However, due to higher comps last May, the annual rate fell to 4.9% from 5.4% in April. Meanwhile, services costs rose by 0.2%, led by margins for automobiles and automobile parts retailing (4.2%). Margins overall increased, as seen in the 1% MoM increase in trade services or business markups. Finally, intermediate processed goods prices fell by -1.5% in May and were unchanged ex-food and energy. Unprocessed goods prices dropped by -4.8% MoM and were down by -3.3% ex-food and energy. Over the last year, core intermediate processed goods prices are down by -2.8%, while core unprocessed goods prices have declined by -13.6% YoY.
Why it Matters: PPI readings continue to trend lower, with monthly changes in core PPI now very steady for six months now. Although declines in food and energy bode well for further weight on core goods and services, business markups remained healthy, showing that despite softer PMI survey data showing falling demand and lower capacity utilization, sellers are still growing margins. We would expect this to change as we enter the downturn phase of the cycle, but we have yet to see lower input costs meaningfully reducing pricing plans on the aggregate due to the continued strength of the end consumer. However, Fed officials will still view this report positively, given the leading nature of PPI on CPI/PCE inflation measures.

*Headline PPI fell more than expected while core was inline, similar to the CPI Report

*Companies expanded margins again, with trade services (business markups) expanding by 1% MoM. PPI ex-Trade Services was flat
Import prices fell by 0.6% in May, following a downwardly revised 0.3% increase in April and compared with the market forecast of a -0.5% decline. On a yearly basis, import prices are lower by -5.9% YoY, the largest decrease in three years. Imported fuel costs declined by -6.4% MoM due to lower petroleum and natural gas prices, which posted the largest one-month fall since August 2022, moving the annual decline to -35.2% YoY. Prices for nonfuel imports edged down by a more meager -0.1% MoM after being unchanged the previous month, moving the annual change to 1.6% YoY. Lower prices for nonfuel industrial supplies and materials and foods, feeds, and beverages more than offset higher prices for automotive vehicles and capital goods. Export prices fell by -1.9% in May, following a revised -0.1% decrease in April and defying the market expectation of a flat reading. It was the largest monthly decline in export prices since last December, led by a -2.1% fall in agricultural export prices and a -1.8% drop in the cost of nonagricultural exports. On a yearly basis, export prices are now lower by -10.1% YoY, the largest decline since the series was first published in September 1984.
Why it Matters: May’s report resumed the deflationary import price trend after some strength in April. Outside the notable drop in fuel import price, the price for foods, feeds, and beverages decreased by -1.1% MoM in May after being unchanged in April. The May decline was the largest 1-month drop since August 2022, with lower fruit prices more than offsetting higher vegetable prices. However, import prices for finished goods categories mainly were up, with autos higher by 0.4% MoM, after ticking up 0.1% in April. Higher automotive parts and capital goods prices also positively contributed, while consumer goods were unchanged after rising 0.1% in April. Separately, the price index for exports to China fell by -2.1% in May and has now fallen by -11.5% YoY, the largest annual drop since the series was first published in December 2018. This drove the U.S. terms of trade with China to decline by 1.9% MoM as lower export prices to China more than offset lower import prices from China.

*Headline import prices fell again in May, mainly due to energy costs significantly declining

*Headline export prices notably fell more than expected due to large falls in both agricultural and nonagricultural products
Retail sales rose 0.3% in May, following a 0.4% increase in April and beating forecasts of a -0.1% decline. The so-called “core retail sales,” which exclude automobiles, gasoline, building materials, and food services, increased by 0.2% MoM, following a 0.6% gain in April. The biggest increases were seen in sales of building materials and garden equipment (2.2%) and motor vehicles and parts (1.4%). The only service category, food services and drinking places, rose by 0.4% MoM, while online retail sales rose by 0.3% MoM. On the other hand, sales were flat at health, personal care, and clothing stores and fell by -2.6% MoM at gasoline stations.
Why it Matters: Retail sales are mostly goods and are not adjusted for inflation, so currently, there's a limited level of usefulness in these reports, given the Fed's focus on core service inflation in determining the future path of policy. With that said, over the last three months, underlying retail sales that feed into the estimate of consumer spending were virtually flat, which points to a slowing in real consumer spending growth. As a result, it’s safe to say we will not see anywhere near the lofty Q1 3.8% PCE growth in the second quarter. Further, the weakest area of underlying sales in the last three months has been furniture sales, which are typically closely related to the housing market. This is a negative counterpoint to the increased level of housing activity recently seen. Finally, retail sales, excluding autos, building materials, and gasoline, the component of this report that feeds into the calculation of non-auto consumer goods spending within GDP, rose by 0.2% in May. However, both March and April were revised lower.

*The majority of categories rose in nominal terms, and with core goods generally driven higher by used cars, most categories were higher in real terms too

*Sales at 10 out of 13 retail categories advanced last month,
The University of Michigan’s Consumer Sentiment Index increased to 63.9 in June, the highest level in four months, from 59.2 in May, preliminary figures showed, beating forecasts of 60. The increase came from both current economic conditions (68 vs. 64.9) and consumer expectations (61.3 vs. 55.4). Year-ahead inflation expectations receded for the second consecutive month to 3.3%, the lowest since March 2021, from 4.2% in May. In contrast, long-run inflation expectations were little changed from May at 3%.
Why it Matters: Consumer sentiment increased significantly more than expected, reflecting a greater optimism due to falling inflation and a resolved debt ceiling crisis. "Consumer sentiment is now 28% above the historical low from a year ago and maybe resuming its upward trajectory since then", Surveys of Consumers Director Joanne Hsu said. However, Hsu further stated, “As it stands, though, sentiment remains low by historical standards as income expectations softened. A majority of consumers still expect difficult times in the economy over the next year.” The large decline in year-ahead inflation expectations will be a welcome sign for Fed officials who June pause was somewhat predicated on inflation expectations still being well anchored.

*Improvements in economic outlook helped move the headline index higher while personal finance views were more stable

*June’s drop in one-year ahead inflation expectations was one of the largest in recent history

*There continues to be a wide divergence among respondents sentiment based on their political affiliation

*This is also true for inflation expectations, with Republican voters seeing inflation 2% higher in a year than Democrats
The NFIB Small Business Optimism Index slightly increased to 89.4 in May from 89 in April, surpassing market expectations of 88.5. The net amount of small business owners expecting better business conditions over the next six months declined one point to 50%. Twenty-five percent of owners reported that inflation was their single most important problem in operating their business, up two points from last month, followed by labor quality at 24% and labor cost increases at 10%.
-8% of owners reported higher nominal sales in the past three months, while -21% expect higher real sales volumes, a decline of three points. Despite this, owners expect inventory increases to increase by five points to a net -2%, while -3% of owners viewed current inventory stocks as “too low” in May, up two points from April. Finally, 20% of owners recently reported that supply chain disruptions still have a significant impact on their business.
-26% of owners reported positive profit trends, down three points from April. Among owners reporting lower profits, 29% blamed weaker sales, 26% blamed the rise in the cost of materials, 12% cited labor costs, and 6% cited lower prices. For owners reporting higher profits, 52% credited sales volumes, 17% cited higher prices, and 16% cited usual seasonal change
19% of owners planned to create new jobs in the next three months. Overall, 63% of owners reported hiring or trying to hire in May, up three points from April. Of those hiring or trying to hire, 89% of owners reported few or no qualified applicants for their open positions. 41% of owners reported raising compensation, up one point from April, while 22% plan to raise compensation in the next three months, also up one point.
The net percent of owners raising average selling prices decreased one point to a net 32% (seasonally adjusted), still an inflationary level but trending down. The share planning to raise prices increased to 29% from 21% in April.
57% of owners reported capital outlays in the last six months, up one point from April. Of those making expenditures, 38% reported spending on new equipment, and 24% acquired vehicles. 25% of owners plan capital outlays in the next few months, up six points from April.
Why it Matter: Despite the headline index remaining below the 49-year average of 98 for the 17th consecutive month, underlying readings showed stronger hiring intentions, elevated job openings, and reports that borrowing needs are being met. As a result, overall small business sentiment did improve in May but remained at historically low levels due to pessimism about the economic outlook. Regarding inflationary pressures, the share of firms currently raising selling prices edged slightly lower, but the share planning to raise prices shot up to the highest percentage since November 2022. NFIB Chief Economist, Bill Dunkelberg, acknowledged that supply chain disruptions and labor shortages continued to hinder the ability of many small firms to meet the demand for their products and services. Still, with now only 20% “being affected by supply chain issues” and 24% citing “labor quality” issues as a chief concern, the trend shows supply-side impairments continue to improve, something we continue to see across a mosaic of other data and anecdotal business reports.
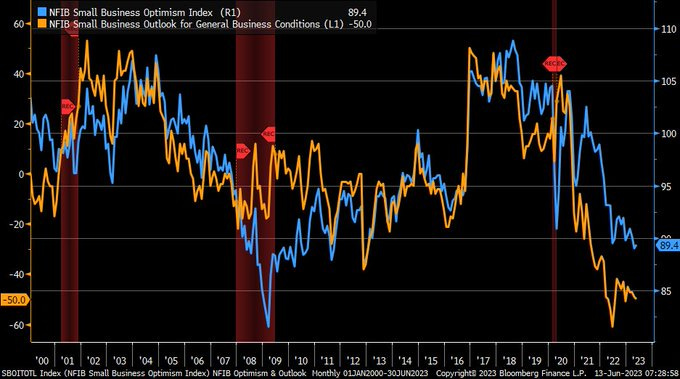
*Despite a slight stabilization in May, The NFIB Index remains in a downtrend as uncertainty over the future outlook weighs heavily on optimism

*There was a mixed bag of increases and decreases across subcategories, with lower expected dales and weaker earnings trends verse increased hiring, inventory restocking, and Capex

*Lower sales expectations juxtaposed against increased hiring plans

*Owners expect tighter credit conditions but also plan to invest more in their businesses
Industrial production decreased by -0.2% in May, missing market expectations of a 0.1% MoM increase. Manufacturing activity increased by 0.1% MoM, in line with expectations. Manufacturing of durable goods and “other manufacturing” (publishing and logging) increased by 0.3% MoM and 0.2% MoM, respectively, while output for nondurable goods declined by -0.1% MoM. Mining output declined by -0.4% MoM, driven primarily by decreases in coal mining and oil and gas well drilling. The output of utilities declined by -1.8% MoM for a second consecutive month, as electric utilities fell, while natural gas utilities remained unchanged. Capacity utilization moved down to 79.6% in May, a rate that is 0.1 percentage points below its long-run (1972–2022) average.
Why it Matters: Most of the decline was driven by lower mining and utility activity, while manufacturing was flat on the month. Construction supplies did pick up by 0.6% MoM, but this was countered by a decline in materials of -0.3% MoM. The report indicates a flat reading for consumer goods and business equipment in May after a strong April. It is worth highlighting that transportation equipment was up 2.5% MoM, confirming the strength seen in other reports. However, motor vehicles and parts did fall to a more neutral level of 0.2% MoM after jumping 10% in April.

*Total manufacturing activity was little changed in May after a strong April

*Vehicle and parts continue to outperform general manufacturing activity, but as inventories are now normalizing, this is not likely to last

*Inventory levels continue to creep higher compared to sales, bringing into question whehter this year’s restocking cycle will be mroe muted
The NY Fed’s Empire State Manufacturing Index climbed 38 points to +6.6 in June from a four-month low of -31.8 in May. Demand and activity measures all bounced back notably, with New Orders (3.1 vs. -28) and Shipments (22 vs. -16.4) moved back into expansionary territory while Unfilled Orders (-8 vs. -13.2) improved less impressively and remained contractionary. Changes in Delivery Times (-1 vs. -5.7) moved closer to neutral, while Inventories (-6 vs. -12.3) contracted by less. Price measures both fell notably, but Prices Paid (22 vs. 34.9) remained further in expansionary territory than Prices Received (9 vs. 23.6). Labor market measures also weakened slightly from April readings with the Number of Employees (-3.6 vs. -3.3) and Average Employee Workweek (-5.8 vs. -3.5) contracting further. Expected six-month ahead general business conditions improved despite expected new orders decreasing, as expected increases in inventories grew significantly and smaller expected increases in shipments and employees drove the overall forward-looking subindex higher. Inflationary measures moved lower but remained well in expansionary territory. Planned increases in capital expenditures and technology spending all rose from more neutral readings to expansionary.
Why it Matters: This data series is fast becoming a little chaotic to follow, but June’s broad improvement in almost every sub-index outside of labor measures signals a more neutral/positive reading of activity in the NY region verse the prior month's alarming contraction. More importantly to the Fed, there was a large drop in current price readings despite greater capacity utilization levels and general demand and activity readings sharply bouncing back, indicating reduced supply-side pressures/impairments, which in the past limited the ability to expand business. Further, a cooling in employee levels and a shorter work week indicate a loosening in labor markets, something the Fed also wants to see. This was somewhat countered by the move further into expansionary territory by future hiring intentions but, when coupled with expanding investment plans, shows lower uncertainty and a greater likelihood for a soft landing.

*Both current and future readings notably jumped higher in June, showing an improved level of demand, activity, and reduced uncertainty

*Hiring intentions continue to expand after bottoming at the beginning of the year

*There were significant drops in both prices paid and received, with the latter now approaching a more neutral reading
The Philadelphia Fed Manufacturing Index decreased to -13.7 in June from -10.4 in May and compared with market expectations of -14. Activity increased with Shipments (9.9 vs. -4.7) bouncing back notably into expansionary territory while demand measures weakened, as seen in further contraction in New Orders (-11 vs. -8.9) and Unfilled Orders (-18.5 vs. 0.8). Delivery Times (-16.1 vs. -9.3) further shortened while Inventory levels (-3.5 vs. 6.4) contracted. Inflation measures were mixed, with Price Paid (10.5 vs. 10.9) barely moving while Prices Received (0.1 vs. -7) moved back to neutral after contracting in May. Labor measures were also mixed with hiring intentions, as seen in the Number of Employees (-0.4 vs. -8.6) moving to neutral, while the Average Workweek (-8.2 vs. -7.7) shortened further. Six months ahead readings broadly improved, with general business activity jumping notably back into expansionary territory due to large rises in expected future new orders and shipments. Future inflation expectations did fall but remain clearly expansionary, while Capex intentions expanded further.
Why it Matters: June’s report was another regional Fed manufacturing report showing a deterioration in current conditions but a more rosy outlook. The broad but more methodical decline at the current sub-index level showed reduced capacity utilization as demand measures fell along with delivery times. However, the jump in shipments back into expansionary territory as well as a more neutral reading on hiring intentions, showed that firms were still active in June, but things continued to slow. The jump back into expansionary territory for future general business activity due to broad increases in new orders and shipments is a positive development in regard to business confidence and reduced uncertainty, which was also reinforced by the expansion of Capex intentions. This month's special question asked whether total production increased in the second quarter. Around 46% of firms reported an increase in Q2 vs. Q1, with most seeing it between 0-5%. Further, firms reported their median capacity utilization rate was higher than in the same period last year, and labor supply was the largest constraint on that utilization rate, with most expecting that not to change much over the next quarter.

*Current and future readings diverged notably in the June report, as expected new orders and shipments jumped higher

*Current subindexes broadly contracted while six-month ahead readings improved, with a notable jump higher in future general business activity

*Firms generally saw some increases in production levels in Q2, while capacity constraints due to labor shortages remain
Technicals, Positioning, and Charts:
The S&P and Nasdaq are outperforming the Russell, with High Dividend Yield, Low Volatility, and Momentum factors, as well as Utilities, Energy, and Consumer Staples sectors all outperforming on the day. Leadership on the week at the sectorial level resumed its more recent pattern, with Tech and Consumer Discretionaries outperforming. However, Industrials and Materials also performed well on the week, with Energy the only sector down. Similarly, Momentum and Growth factors outperformed, while Small Caps and High Dividend Yields underperformed on the week as Treasury yields rose and the Russell traded sideways.

@KoyfinCharts
S&P optionality strike levels have the Zero-Gamma Level at 4367 while the Call Wall is 4425 and Put Wall is 4000. Spotgamma sees the option positioning that has been driving markets higher as now bordering on the absurd. The high level of call IV at individual name levels is now spilling over into the overall index. The risk reversal reading for the SPX is now at its highest level ever (going back to 4/20). This means the prices being paid for a one-month 25 delta call relative to a one-month 25 delta put is now higher than at any of those liquidity-fueled, meme-fueled manias of 2020/21. Finally, yesterday's rally led to more call positions being opened above 4,400, while a large number of puts were also added at that strike. However, +30% SPX gamma is tied to today's expiration, so things will look different next week.

@spotgamma
S&P technical levels have support at 4465, then 4450, with resistance at 4500, then 4515. The S&P put in a classic high momentum technical breakout of the February and May highs, a level around 4280, and this was the signal that we were entering a dip buying rally, and we rallied 170 points since. We remain in an upsloping channel (seen in white). Currently, the 4390-zone is the first real critical support level, a break below that would indicate a potentially longer-lasting sell off while 4430 is the backtest support area.

@AdamMancini4
Treasuries are lower, with the 10yr yield rising to 3.77%, higher by around 5 bps on the session, while the 5s30s curve is flatter by 7 bps on the session, moving to -14 bps.

Four Key Macro House Charts:
Growth/Value Ratio: Value is higher on the day but little changed on the week, with Large-Cap Growth the best-performing size/factor on the week.

Chinese Iron Ore Future Price: Iron Ore futures are higher on the day and the week.

5yr-30yr Treasury Spread: The curve is flatter on the day and the week.

EUR/JPY FX Cross: The Euro was stronger on the day and on the week.

Other Charts:

“$2.2 Trillion notional $SPX/ $SPY contracts are set to expire today (6/16) during the quarterly expiration. This will be the largest June OpEx on record” - @t1alpha

“Since S&P 500’s October low, forward P/E of the 50 largest stocks (blue) is up by 30% … there hasn’t been any gain in forward EPS (orange) over the same timeframe” - @LizAnnSonders

“Earnings estimates are tracking higher, outpacing downgrades for the 1st time since 2021.” - @SethCL

The S&P advance-decline line looks technically more bullish as it is just 384 net advances from a new all-time high. – Suttmeier at BofA Research

There is a general sense that FOMO flows are taking over and we are nearing a tactical top as equities experienced their strongest inflow since March 2022 this past week with $25.62 billiong coming in.

“If the Fed holds the fed funds rate steady and inflation declines, real rates rise. Rising real rates mean policy is still tightening.” - @KathyJones

Comparing the Frequency of Supply Chain Disruption vs. Inflation-Related Discussions on S&P 500 Earnings Calls - @M_McDonough

The average of six national measures showed new-lease asking rents rose less than less than 2% in the 12 months ended in May, slowing from the double-digit clip of a year ago, according to data firm CoStar Group and rental-software company RealPage.
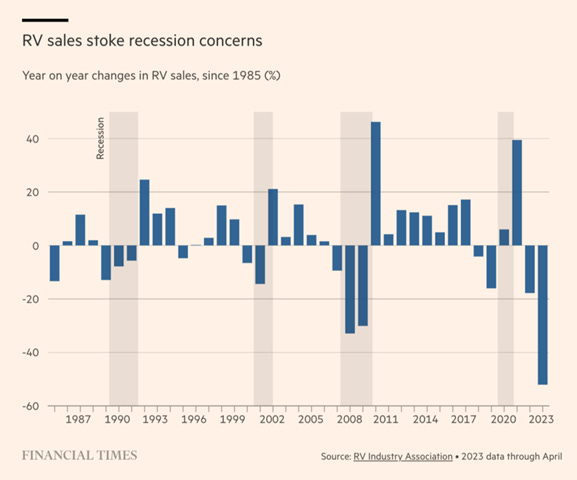
"A discretionary purchase that is typically financed with borrowed money, demand for RVs is acutely sensitive to business cycles, meaning that more often than not a cooling off typically augurs a weaker economic backdrop." - @colbyLsmith

Fast-falling demand for cardboard boxes suggests a deceleration in economic activity. – BofA Research
Articles by Macro Themes:
Medium-term Themes:
China’s Post-Pandemic Life:
Finally Action?: China is considering a broad package of stimulus measures as pressure builds on Beijing to boost the world’s second-largest economy. The stimulus proposals, drafted by multiple government agencies, include at least a dozen measures designed to support areas such as real estate and domestic demand. Further interest-rate reductions are also among the policies under consideration. Investor speculation about looming cuts to China’s longer-term policy rates intensified on Tuesday after the central bank unexpectedly lowered its seven-day reverse repurchase rate. A key part of the proposed stimulus package involves supporting the real estate market. Regulators are seeking to lower costs on outstanding residential mortgages and boost re-lending through the nation’s policy banks to ensure homes are delivered. - China Weighs Broad Stimulus With Property Support, Rate Cuts - Bloomberg
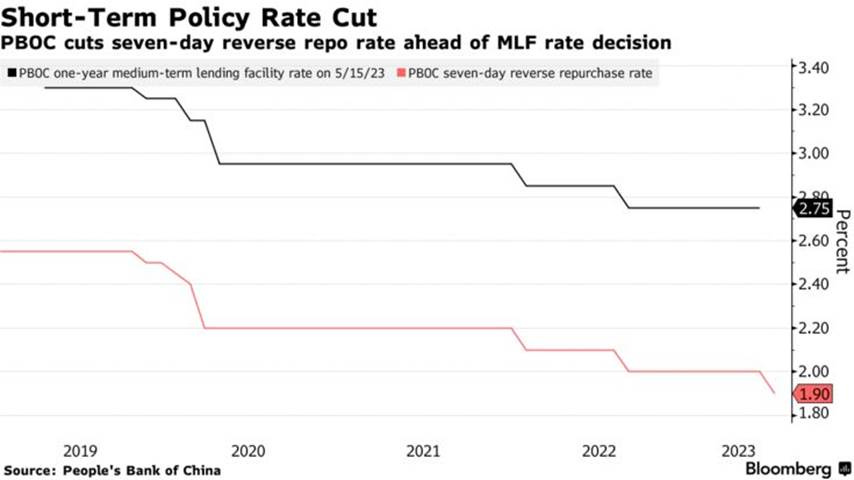
Trending Lower: The Chinese yuan has weakened against the U.S. dollar over the past three months and traded above 7.17 per dollar in Hong Kong, near where it was in November 2022. Two big factors influencing the performance of the yuan against the dollar are the difference in interest rates between China and the U.S., and the growth trajectory of the world’s second-largest economy, with neither looking favorable for the yuan. On Tuesday, the PBoC announced a cut to its seven-day reverse-repo rate, which it uses to provide funding to banks. That came as a surprise to some analysts. “Usually, they cut the MLF and the interbank rates together,” said Ben Luk, a senior multi-asset strategist at State Street Global Markets. “They are sending a signal that they will provide support regardless of what the Fed will do.” - Yuan Under Pressure as U.S., China Rates Set to Diverge Further – WSJ

Longer-term Themes:
Cyber Life and Digital Rights:
Bad for Good: Intelligence collected under the Section 702 surveillance authority allowed the U.S. government to successfully identify the hacker behind the 2021 ransomware attack on Colonial Pipeline, senior Biden administration officials told reporters Monday in the White House’s latest push to declassify intelligence material that might build support for reauthorizing the law. Since appealing to lawmakers in February to renew the tool, the Biden administration has argued that Section 702 is vital to combat an array of national security threats to the homeland and that it plays an especially vital role in combating cyber threats. A senior FBI adviser recently told CyberScoop that a “plurality” of Section 702 searches by the agency pertaining to investigations into nation-state cyberattacks. Section 702 allows intelligence agencies to collect the communications of non-U.S. persons abroad whose communications transit U.S. telecommunications systems. However, the program’s incidental collection of Americans’ data, which can then be searched by the FBI, has raised oversight concerns from civil liberties advocates and many lawmakers. It will be important to watch where Section 702 goes. - Section 702 data helped take down Colonial Pipeline hacker, Biden administration says - CyberScoop

New Accounts: US cyber insurance premiums surged 50% in 2022 as increased ransomware attacks and online commerce drove demand for coverage. Premiums collected from policies written by insurers reached $7.2 billion in 2022 and tripled in the past three years, rating firm AM Best said in a study released this week. Loss ratios for standalone and packaged policies settled down to 43% and 48%, in signs of life for the industry after incurred losses had increased in 2020 and 2021. Surplus lines insurers, which patch unique risks uncovered by conventional policies, are also gaining popularity. AI tech and a resurgence of ransomware attacks in 2023 will ensure a steady stream of rising demand for cyber security insurance, Christopher Graham, an AM Best senior industry analyst, said in the statement. - Cyber Insurance Premiums Surge by 50% as Ransomware Attacks Increase - Bloomberg

A.I. All Day:
Building Guardrails: The European Parliament passed a draft law known as the A.I. Act, which would put new restrictions on what is seen as the technology’s riskiest uses. It would severely curtail the uses of facial recognition software while requiring makers of A.I. systems like the ChatGPT chatbot to disclose more about the data used to create their programs. The vote is one step in a longer process. A final version of the law is not expected to be passed until later this year. The European Union is further along than the United States and other large Western governments in regulating A.I. The 27-nation bloc has debated the topic for more than two years, and the issue took on new urgency after last year’s release of ChatGPT, which intensified concerns about the technology’s potential effects on employment and society. - Europeans Take a Major Step Toward Regulating A.I. - NYT

Energy’s Midlife Crisis:
Output from OPEC’s 13 members slumped by 464K barrels a day to 28.07 million barrels a day, the cartel said in its monthly market report, citing figures sourced from independent data providers. The drop suggests the group’s members have largely made good on a pledge announced in April to reduce their collective output. But the figures also show an uptick in production from other members who aren’t party to the plan that could soften the cuts’ impact on oil prices. OPEC and a collection of Russia-led allied nations, known collectively as OPEC+, pledged in April to reduce oil production by around 1.1 million barrels a day from May onward. Russia said it would extend an already announced 500K barrel-a-day production cut, but it is unclear if this is being honored. However, producers in Africa (Nigeria and Angola), Iran, Iraq, and Venezuela all saw their production levels increase, weighing on prices as demand expectations have not materially changed. - OPEC Crude Production Slumps as Voluntary Cuts Bite – WSJ

Food: Security, Innovations, and Climate Change Implications:
Extreme Weather Coming: The arrival of the first El Niño in almost four years foreshadows new damage to an already fragile global economy. The shift to a warming phase from the cooler La Niña can generate chaos, especially in fast-growing emerging economies. Power grids strain, and blackouts become more frequent. Extreme heat creates public health emergencies, while drought adds to fire risks. Crops are lost, roads are flooded, and homes are destroyed. According to Bloomberg Economics modeling, previous El Niños resulted in a marked impact on global inflation, adding 3.9 percentage points to non-energy commodity prices and 3.5 points to oil. They also hit growth to gross domestic product, especially in Brazil, Australia, India, and other vulnerable countries. Combined with more extreme weather and hotter temperatures due to accelerated climate change, the stage is now set for the world’s costliest El Niño cycle since meteorologists started keeping track. - Return of El Niño Threatens New Levels of Economic Destruction - Bloomberg

Testing Supply: The world is awash in rice, with global stockpiles at close to record levels. But, according to the US Department of Agriculture, the world’s stockpiles of rice are forecast to drop 5% this season due to the arrival of El Niño. The weather pattern usually brings hotter and drier conditions to Asia, which produces and consumes 90% of the global rice supply. Thailand, the world’s second-biggest exporter, has already asked farmers to reduce their planting because of lower rainfall. Importers are starting to become wary, ramping up purchases in recent months. Vietnam, the world’s third-largest exporter, shipped 40% more rice to the Philippines in the first four months of 2023 compared with a year ago. Exports to China surged more than 70% and to Indonesia by almost 2,500%, according to Vietnam’s Customs Department. - World’s Rice Glut Will Be Put to the Test With El Niño’s Return - Bloomberg

ESG versus the World:
Pivot Their Messaging: Finance chiefs and other executives have significantly quieted down in public settings about their environmental and employee diversity efforts as the opposition has mounted from a confluence of interests: investors who want companies to focus on their operations, not the social good, and conservative groups and political leaders who have seized on corporate support of such causes to rally “anti-woke” constituents, for example, calling for boycotts of brands that advertise their support of the LGBT community in the wake of recent disputes with Target and Bud Light. Executives at U.S.-listed companies mentioned “environmental, social and governance,” “ESG,” “diversity, equity and inclusion,” “DEI” or “sustainability” on 575 earnings calls from April 1 to June 5, down 31% from the same period last year, according to data from financial-research platform AlphaSense. That is the largest such year-over-year decline and the fifth consecutive quarter of year-over-year drops. - Companies Quiet Diversity and Sustainability Talk Amid Culture War Boycotts – WSJ

Asian Tigers 2.0:
X-China Asia: Global fund managers say they are rushing to meet client demand for new Asian investment products that exclude China, as investor appetite for the region’s largest economy is hit by slowing growth and mounting geopolitical risk. Fund managers said requests for “ex-China” products included the possibility of “Asian allies” funds that would invest in US-friendly markets and provide clear insulation from Beijing-related geopolitical risk in the region. The widespread adoption of such investing would mark one of the biggest structural shifts for Asia-Pacific markets since the advent of “Asia ex-Japan” portfolios roughly three decades ago, according to asset managers. The main driver of the trend towards ex-China investment is “economic, not geopolitical” because many emerging markets investors viewed China’s weighting in investment benchmarks from the likes of MSCI and FTSE as too large, tilting the balance away from markets such as Vietnam, Thailand, and Indonesia. - Demand grows for Asian investment products that exclude China - FT

Cold Places (Deep Sea, Artic, and Space Colonization):
Two Internets: Nearly 1.4mn kilometers of metal-encased fiber crisscrosses the world’s oceans, speeding internet traffic seamlessly around the globe. Companies from France, the US, and Japan have dominated the supply and installation of these cables. However, the Chinese government started successfully penetrating the global market, but consecutive US administrations have since managed to freeze China out of large swaths of it. This was ostensible because of concerns of espionage and worries about what Beijing might do to disrupt strategic assets operated by Chinese companies in the event of a conflict. Despite being routinely blocked from international subsea cable projects involving US investment, Chinese companies have adapted by building international cables for China and many of its allied nations. This has raised fears of a dangerous division in who owns and manages the infrastructure underpinning the global web. - How the US is pushing China out of the internet’s plumbing - FT

Podcasts and Videos:
VIEWS EXPRESSED IN "CONTENT" ON THIS WEBSITE OR POSTED IN SOCIAL MEDIA AND OTHER PLATFORMS (COLLECTIVELY, "CONTENT DISTRIBUTION OUTLETS") ARE MY OWN. THE POSTS ARE NOT DIRECTED TO ANY INVESTORS OR POTENTIAL INVESTORS, AND DO NOT CONSTITUTE AN OFFER TO SELL -- OR A SOLICITATION OF AN OFFER TO BUY -- ANY SECURITIES, AND MAY NOT BE USED OR RELIED UPON IN EVALUATING THE MERITS OF ANY INVESTMENT.
THE CONTENT SHOULD NOT BE CONSTRUED AS OR RELIED UPON IN ANY MANNER AS INVESTMENT, LEGAL, TAX, OR OTHER ADVICE. YOU SHOULD CONSULT YOUR OWN ADVISERS AS TO LEGAL, BUSINESS, TAX, AND OTHER RELATED MATTERS CONCERNING ANY INVESTMENT. ANY PROJECTIONS, ESTIMATES, FORECASTS, TARGETS, PROSPECTS AND/OR OPINIONS EXPRESSED IN THESE MATERIALS ARE SUBJECT TO CHANGE WITHOUT NOTICE AND MAY DIFFER OR BE CONTRARY TO OPINIONS EXPRESSED BY OTHERS. ANY CHARTS PROVIDED HERE ARE FOR INFORMATIONAL PURPOSES ONLY, AND SHOULD NOT BE RELIED UPON WHEN MAKING ANY INVESTMENT DECISION. CERTAIN INFORMATION CONTAINED IN HERE HAS BEEN OBTAINED FROM THIRD-PARTY SOURCES. WHILE TAKEN FROM SOURCES BELIEVED TO BE RELIABLE, I HAVE NOT INDEPENDENTLY VERIFIED SUCH INFORMATION AND MAKES NO REPRESENTATIONS ABOUT THE ENDURING ACCURACY OF THE INFORMATION