


Are Things Starting to Break? Financial Instability and Falling Wages = 25bp Hike in March Despite Expected Hotter CPI - MIDDAY MACRO WEEKEND READ– 3/10/2023
Color on Markets, Economy, Policy, and Geopolitics

Are Things Starting to Break? Financial Instability and Falling Wages = 25bp Hike in March Despite Expected Hotter CPI - MIDDAY MACRO WEEKEND READ– 3/10/2023
Overnight and Morning Recap / Market Wrap:
Price Action and Headlines:
Equities are lower, ending the week on a negative note, with small-caps significantly lower due to the weakness in regional banks; however, all sectors were lower on the week by at least -2%, initially due to a more hawkish Powell but now more because of the SVB drama
Treasuries are higher, with today’s significant move lower in yields across the curve negating rises earlier in the week as the 50bp hike narrative completely reversed due to growing financial stability concerns and a jobs report that showed reduced inflationary pressures despite a headline beat
WTI is higher, up today to $76.50 but down on the week; however, in the middle of its multi-month range as high inventory levels, mixed China demand views, and continual supply concerns in the second half of the year keep it range-bound and lacking a breakout/down catalyst

Narrative Analysis:
Markets are trying to decide if the demise of Silicon Valley Bank is an isolated event or indicative of a future bigger problem as higher rates increasingly weigh on banks’ asset values and funding costs, increasing financial stability concerns. The decisive risk-off tone to the end of the week due to the SVB saga has moved the Fed’s March rate hiking expectations back to 25bps after a more hawkish Powell earlier in the week indicated they were considering a 50bps move due to the solid start of the year. Today’s jobs report was a little bit of a mixed bag, with the stronger-than-expected headline number juxtaposing cooler internals as wages and hours worked fell while participation improved, driving higher the UER. The general worries over financial stability moved Treasury yield significantly lower, with the two-year back at 4.6% after touching over 5% earlier in the week. This should have been more supportive to equities, which had again been positively correlating to moves in rates until mid-week, but a flight to safety saw small caps down over -7% on the week due to their heavy exposure to regional banks. Oil was little changed on the week, with the geopolitical picture stable, while lower demand helped inventories continue to build. At the same time, warm weather pressured natural gas lower. Industrial metals were better bid, despite a more risk-off tone out of China, as seen in their slumping equity markets, with copper hanging in around $4. The agg complex was lower due to grains despite uncertainty over the Russia-Ukraine grain corridor. Finally, the dollar was little changed on the week after being up following Powell’s hawkish prepared testimony remarks, with the $DXY ending the week around 104.5. Please see our “Deeper Dive” section for more in-depth commentary on our current market/economy views.
The Nasdaq is outperforming the S&P and Russell with Momentum, High Dvd Yield, and Low Volatility factors, as well as Consumer Staples, Consumer Discretionary, and Healthcare sectors all outperforming on the day. The week had a risk-off tilt with Staples, Utilities, and Tech as well as Low Vol, Momentum, and Growth outperforming while Financials, and by relationship, Small-Caps were hardest hit, although every sector is down by more than -2% on the week. A notable change in leadership occurred due to the SVB saga.

@KoyfinCharts
S&P optionality strike levels have the Zero-Gamma Level at 4019 while the Call Wall is 4200 and Put Wall is 3900. The bearish downside setup is very good, as there is a large level of VIX call open interests, and we are only a week from the large quarterly March OPEX. Further, due to regional bank risks, traders may not want to be short volatility over the weekend or into next week's CPI. Therefore, this is a situation in which the negative gamma/vanna feedback look pulls the market down, as we are seeing today. Finally, while put volumes & interest haven’t jumped markedly higher, there was a clear response in implied volatility rising.

@spotgamma
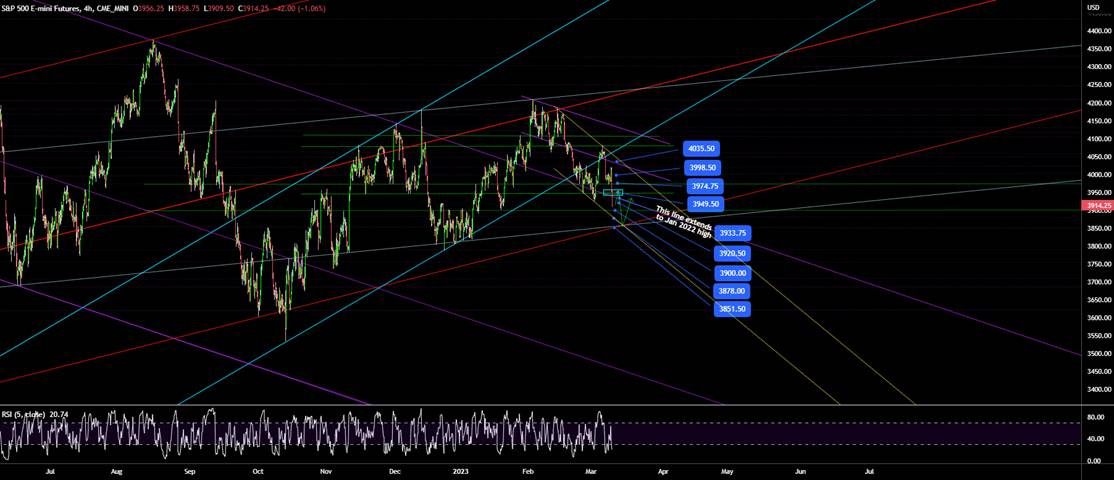
S&P technical levels have support at 3905 (major), then 3885, with resistance at 3935, then 3950 (major). The S&P lost several critical support levels in the last two days. Firstly, the multi-day 3975 support failed, which triggered the large move lower. The 200-dma was also broken along the way. We also cracked below both last week's low as well as the critical trendline from Jan 2022, which back-tested last Friday to trigger the 160+ point rally. This is now 3930-35, and we are below currently. The recovery of the 3925ish area would mean a failed breakdown of the March 2nd low. Until that reclaims, and ultimately 3950, momentum is with bears.
@AdamMancini4
Treasuries are higher, with the 10yr yield at 3.69%, lower by 22 bps on the session, while the 5s30s curve is steeper on the session, moving to 8 bps.

Deeper Dive:
The markets had another eventful week that ended with the first FDIC-insured bank closure of 2023 and a complete reversal of the 50bp hike narrative for the March FOMC meeting following the hawkish Powell testimony earlier in the week. Recessionary fears are again on the rise, causing rates and equities to decouple, with a flight to safety and reduced “higher for longer” views moving yields notably lower today. At the same time, despite no material weakness on the economic data front over the week, as the jobs and factory orders reports were undoubtedly solid, equities, especially financials, are under increasing pressure as financial stability concerns rise. We continue to believe the economy is cooling, despite the hotter start to the year. We see today’s job report as structurally deflationary despite the better-than-expected headline number, something we delve deeper into in our “Econ Data” section. When coupled with lower levels of quits, as seen in the JOLTs report, rising job cuts, as seen in the Challenger Jobs Report, and an increase in initial claims, we have growing conviction that peak labor market tightness is behind us. As a result, we see peak Fed hawkishness now behind us, a view emboldened by growing financial stability concerns. This, of course, does not mean “risk-on” by any means. Still, it should allow for financial conditions and real rates to trend into a more accommodative territory, becoming less volatile as Fed policy uncertainty falls. As a result, we are inclined to leave our mock portfolio positions alone for now, continuing to incur losses in EM, especially China-related positions, and Nasdaq longs while only benefiting from our long-end Treasury long and having more neutral returns in our Copper and Oil longs. With the S&P now in a much weaker technical picture (below the 200-dma and 2022 downtrend channel) and positive seasonals not yet helping, next week’s CPI will likely dictate the next major move in risk assets. With expectations for a hotter-than-expected reading high and positioning more defensive, we are willing to hold off on any de-risking until it points the way. However, and as a final thought, any increase in negative contagion (due to growing counter-party risk) throughout the financial system that may be brought on by a hotter CPI print next week, which would raise “higher for longer” expectations and hence further pressure the asset and liability side of banks, is a very serious tail risk and we would advise a significant de-risking if recent drops in yields were to reverse violently. As is the mantra currently, stay tactical and keep risk management tight.
Although the Fed has taken what the market has given it during this tightening cycle (due to guiding the market there), it does not make sense to increase the size of rate hikes back to 50bp at the March FOMC meeting, given the current backdrop and where things are heading. The growing belief (until today) that this may happen created further policy uncertainty, increasing rate and equity volatility, and undermined the Fed’s credibility to orchestrate a soft landing. The reason the Fed reduced the size of rate hikes since November was due to growing signs that inflation had peaked and was trending lower, while the cumulative effects of the tighter policy had yet to impact the economy due to the uncertain lags in its transmission mechanisms. Basically, the two-sided risk approach outlined by Brainard at the end of last year, and adopted by others, is still the proper way to proceed despite the strong start to the year.

*Core service X-shelter inflation is the last man standing, given we know where shelter costs are going, and it is unlikely goods inflation meaningfully picks back up, and with ISM service prices’ 3-month average falling, it is likely official CPI data follows soon

*The Fed’s forecasting and communication remain problematic, but the strong actions taken to date give the market comfort that the inflation-fighting mission will be accomplished

*The biggest problem for policymakers has been “long, variable and uncertain lags in the transmission mechanism of policy” due to the lower rate sensitivity of the economy. Basically, households and businesses used the pandemic to lock in lower-for-longer financing costs
As noted above, we believe the new labor market data this week, on top of what we already knew, is fundamentally positive as it allows the Fed to be less worried about wage spiral inflation dynamics becoming entrenched, something that represents a much bigger problem and harsher policy response. The Fed foolishly tied its policy path to the jobs market despite clear signs of structural changes to labor market participation and the relationship between unemployment and inflation. To be clear, this is currently a hot topic of debate and something Summers and Blanchard discussed in great detail during a debate on the future of interest rates at the Peterson Institution this week. Wherever the “experts” fall, our belief remains that the majority of the current inflationary pulse is supply-shock driven, meaning cost-push pressures continue to outweigh demand-pull drivers in setting the direction of inflation moving forward, with labor shortages being the last piece of the puzzle. As a result, more labor currently entering the market is less inflationary than during more normal times as it reduces shortages/frictions and indicates that wages are at levels correcting supply-demand imbalances. The demand-pull effects of higher aggregate income levels are also being negated by the lower-income jobs that are being created. When coupled with lower hiring intentions and increased layoffs in higher-income jobs, it adds to a loosening labor market narrative that is seeing falling average hourly wages, shorter work weeks with less overtime, resulting in less labor negotiating power and falling levels of turnover, all things the Fed is trying to orchestrate currently.

*As a reminder, job changers have driven the majority of wage inflation…

*But quits continue to fall, moving further into negative territory on an annual percentage basis

*Decreases in temporary workers are a leading indicator that the overall job market will cool

*Small businesses are responsible for the bulk of employment, and greater uncertainty will increasingly reduce hiring intentions
Turning to worries regarding financial stability, something increasingly troublesome given regional bank stocks are down almost -20% on the week, this week’s drama surrounding Silicon Valley Bank may convince Fed officials to slow/stop the pace of tightening. SVB, now under FDIC control, experienced an old-fashioned bank run as depositor withdrew their funds, forcing the bank to sell bonds at a loss, wiping out the equity value of the institution before further capital could be raised. This “situation” is not occurring in isolation, with other regional banks experiencing similar pressures on their liabilities and assets. At the same time, their equity values and access to interbank credit are under pressure due to contagion. This should worry Fed officials, who, by the way, at the regional level, work for a board of bank owners that are likely angrily calling them. By raising money market rates so rapidly over the past year, the result has been disintermediation as depositors pull their funds, forcing banks to increase their deposit rates, which narrows their interest margins on loans so they will make fewer of them while also causing the liquidation of AFS assets at losses. If the Fed wanted to reduce liquidity and reset the credit cycle, monetary policy is already sufficiently tight enough to do so. As a result, given the increasingly unorderly market price action for bank equities and credit and the risk it gets worse, especially for regionals, it is unlikely the Fed can raise rates much further while still engaging in QT without breaking things to the point that financial stability concerns outweigh price stability ones.

*The mythical money multiplier is falling fast as loan creation is likely to fall further, already seen trending lower due to tighter standards and lower demand

*Small banks will increasingly have tighter margins due to rising depository rates, while the asset side suffers from worsening duration and credit risks

*Despite high levels of deposits in the system, higher-yielding money market alternatives will drive up wholesale funding costs for financial institutions, compressing profit margins

*The GSIBs are still showing no credit risk worries even if regional banks are

*The mock portfolio is at its lowest return level of the year, with our nickel long stopping out while we are willing to wait on other positions due to a belief that current market volatility will pass and fundamentals still favor an EM and tech overweight due to loosening financial conditions and a more dovish future Fed outlook as well as stronger growth out of China
Econ Data:
The Job’s report showed nonfarm payrolls increased by 311K jobs in February, well above market forecasts of 205K. Total job gains in the prior two months were revised down by -34K (and the gains in private payrolls in December and January were revised down by -94K). The three-month average is now 351K per month and is not slowing from the 12-month average gain of 362K. Notable job gains occurred in leisure and hospitality (105K) and retail (50K). On the other hand, employment declined in the information (-25K) and transportation and warehousing (-22K). The unemployment rate rose to 3.6% from a 50-year low of 3.4% in January and above market expectations of 3.4%. The U-6 unemployment rate, which also includes people who want to work but have given up searching and those working part-time because they cannot find full-time employment, rose to 6.8% in February from 6.6% in January. The labor force participation rate rose to 62.5%, up from 62.4 in the previous month. Average hourly earnings rose 0.2% MoM, while markets had expected them to remain at 0.3% MoM, with nonsupervisory employees increasing by 0.5% MoM. The average workweek edged down by 0.1 hours to 34.5, with manufacturing, nonsupervisory, and overtime hours all falling.
Why it Matters: This report had a little something for everyone, with the Fed likely viewing it more neutral than the stronger-than-expected healding reading indicates. This is because the overall level of jobs created in a given month is becoming secondary to other labor market indicators in many ways. With average hourly earnings falling, the participation rate rising, increases in the unemployment rate, and various measures of the average weekly hours worked showing reduced capacity pressures, the overall inflationary story from the report was less problematic. Further, job gains in leisure & hospitality and retail, the sectors most associated with core-service inflation, reduce the need to raise wages further due to a better labor supply and demand balance already occurring. Said another way, we would be more concerned if the areas of the economy that had the largest opening and were increasingly driving the inflation narrative were not attracting a large number of workers. This would indicate a need to raise incentives (aka wages and benefits) and hence increase inflationary wage spiral concerns moving forward. This does not seem to be occurring. There is also some suggestion that weather may have boosted the gains in February (as with January), with the number of employees not at work due to bad weather being 177K below the typical February reading. The gains in February’s payrolls were also far less broad-based than in January, with only 56.0% of industries adding to payrolls versus 68.0% in January and 84.6% in February 2022. Further, the participation rate is now at the highest level since March 2020, with prime-aged workers (25-54 years old) participation back to a pre-pandemic level. February also saw the smallest growth in average hourly earnings in a year. The three-month annualized rate of change eased to 3.6%. This is due to lower levels of turnover, as seen in the JOLTs report and heard elsewhere, as well as lower-income cohort hiring driving the overall NFP gains, a group that will increasingly have less wage bargaining power and does not historically drive demand-pull inflationary pressures.

*The three-month average is 351K, but seasonality and warm weather conditions seem to be playing a part in the higher NFP prints

*The sectors with the highest openings continue to hire the most workers, while the breadth of hiring across industries fell

*Wage growth slowed to 0.2% in February, for an average of 3.6% annualized growth over the last three months (down from 4.5% in the three months prior)

*As seen elsewhere, firms continue to reduce capacity by decreasing hours worked, especially over time

*Higher inflation, reduced savings, and greater uncertainty are improving participation, especially among prime-aged workers

*Non-white workers are seeing larger increases in their UER, something the Fed was focused on prior to our current inflation fiasco
The number of job openings fell by 410K to 10.824 million in January from an upwardly revised 11.234 million in December, compared to market expectations of a 10.5 million decrease. Over the month, the largest decreases were in construction (-240K), accommodation and food services (-204K), and finance and insurance (-100K). On the other hand, the number of available positions increased in transportation, warehousing, and utilities (+94K) and nondurable goods manufacturing (+50K). Meanwhile, the number of hires and total separations was little changed at 6.4 million and 5.9 million, respectively. Within separations, quits decreased by 207K to 3.884 million, the lowest level since May 2021, while layoffs and discharges went up to 1.7 million. The so-called quits rate, which measures voluntary job leavers as a share of total employment, edged down to 2.5% from December's revised figure of 2.6% and was down from a record high of 3.0% seen at the end of 2021.
Why it Matters: As a reminder, the JOLTs data is two months old by now, and as we have highlighted in previous writing, private hiring firm data continues to show a significant decline in postings. As a result, the higher-than-expected openings are not as meaningful at this point despite Powell's emphasis on it in the past. Basically, we know it should continue to trend lower. We also take comfort in construction and leisure and hospitality having the largest declines, the first being more rate sensitive and the second reducing wage-spiral fears in part of the core-service sector. Finally, the Fed can take some comfort in the level of quits falling, specifically in Professional and business services, as it reduces wage-spiral inflationary fears in a higher-income cohort. However, with the “official data” showing 1.9 vacancies per unemployed job seeker, the decline in job openings does not indicate any meaningful improvement in the balance between labor demand and labor supply from the perspective of the Federal Reserve.

*Declines in openings in construction, accommodation/food services, and finance drove total private-sector job openings lower by -356K

*Quit rates continue to fall, mainly due to the professional service sector, and this may be a leading indicator of fewer quits to come

*The number of openings to unemployed is still near recent highs, indicating the labor market remains historically very tight

*With a 30% survey response rate, the quality of the JOLTs data has materially worsened over the last few years
Employers announced 77.8K job cuts in February, the most for the month of February since 2009 and compared to 102.9K in January, which was the highest reading since September of 2020. Job cuts occurred in all 30 industries, led by technology (21,4K) and health care/products (9,7K). Companies announced plans to hire 28.8K workers in February, down 12% from the 32.7K hires announced in
Why it Matters: So far this year, employers announced plans to cut 180,713 jobs, up 427% from the 34.3K cuts announced in the first two months of 2022 and the highest January-February total since 2009. The tech sector has announced 35% of all job cuts in 2023. Hiring plans are down 87% from February 2022. So far this year, companies announced plans to hire 61.6K workers, the lowest January-February total since 2016. “Certainly, employers are paying attention to rate increase plans from the Fed. Many have been planning for a downturn for months, cutting costs elsewhere. If things continue to cool, layoffs are typically the last piece in company cost-cutting strategies,” said Andrew Challenger, Senior Vice President of Challenger, Gray & Christmas, Inc.“Right now, the overwhelming bulk of cuts are occurring in Technology. Retail and Financial are also cutting right now, as consumer spending matches economic conditions. In February, job cuts occurred in all 30 industries Challenger tracks,” he added.

*2023 has the highest level of cuts since 2009 in its first two months, which is not a great sign of things to come

*Market/economic conditions continue to be the highest reason for cuts cited by surveyed firms
New orders for manufactured goods fell by -1.6% in January, after a downwardly revised 1.7% rise in December, and better than market forecasts of a -1.8% drop. Orders for transportation dropped by -13.3% due to a -54.5% decline in new orders of nondefense aircraft and parts. Factory orders excluding transportation, increased by 1.2%, recovering from a -1.2% decline in December. There were monthly increases in new orders for machinery (1.6%), electrical equipment, appliances, and components (1.3%), and computers and electronic products (0.6%). Motor vehicle bodies, parts, and trailers were also higher by 1.3% MoM. Shipments rose by 0.7% MoM, and excluding transportation, were higher by 1.2% MoM. Finally, unfilled orders were flat on the month.
Why it Matters: Other than the significant drop in transportation equipment due to nondefense aircraft and parts, most industry groups were higher on the month. Half the subcategories saw reversals in declines last month for new orders and shipments. Most notably, capital goods excluding aircraft saw both shipments (1.1% vs. -0.6% in Dec) and new orders (0.8% vs. -0.3%), indicating that despite a decline in Capex intentions seen increasingly in recent business surveys, investment in capital goods picked up after two months of declines. Interestingly motor vehicles and parts saw a slower growth rate in new orders while shipments were flat, something that contradicts purchase activity data for that industry seen elsewhere.

*Factory orders fell overall on the month due to the large decline in transportation equipment, moving the YoY increase to 4.3%

*Factory orders for capital goods rose on the month, indicating businesses are still expanding and making investments in themselves
Total consumer credit rose by $14.8 billion in January, after a downwardly revised $10.69 billion increase in the previous month and missing market expectations of a $20 billion rise. On an annual basis, consumer credit increased by 3.7% in January after an upwardly revised 2.9% gain in the prior month. Revolving credit increased 11.1%, compared to a downwardly revised 6.9% rise in the prior month. Non-revolving credit increased by 1.2%, following a downwardly revised 1.3% gain in the prior month.
Why it Matters: Total consumer credit grew by less than expected, although the use of revolving credit reaccelerated after slowing in December. This is in line with the increase in consumer activity generally seen at the start of the year. However, non-revolving, which has a higher rate sensitivity, continues to slow, showing demand for big-ticket items, especially autos, is increasingly being weighed on by higher financing costs. This means the recent increases in used-car prices may not be sustainable as demand and supply better balance.
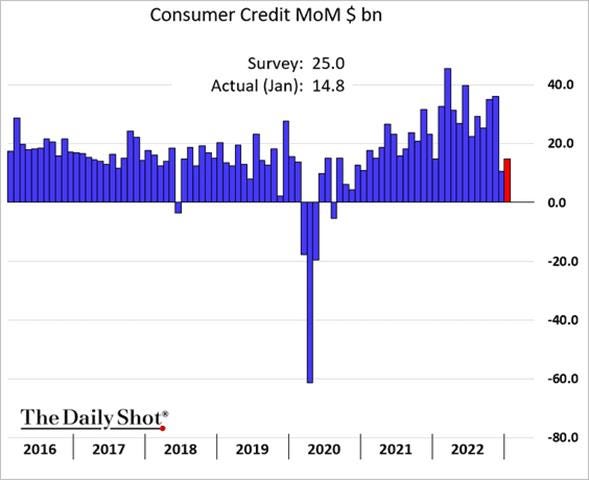
*Increases in overall consumer credit came in weaker than expected, with revolving credit increasing but non-revolving trending lower again

*Revolving credit is now back to its long-run growth trend after dropping notably during the pandemic
Policy Talk:
With the Fed entering its March FOMC Blackout period next week and Powell giving his painful-to-watch testimony to the Senate and House this week, we had fewer other Fed speakers than normal. The more hawkish overtone from Powell’s prepared remarks and little new information during Q&A regarding the path of policy had markets at one point pricing in a high chance of a 50 bps hike coming out of the March meeting. As a result of the lack of other Fed speakers, we will focus on the Beige Book and a research paper released by the SF Fed in this week’s “Policy Talk” section.
Chairman Powell gave his Semiannual Monetary Policy Report to Congress,where he summarized the released report and answered questions from politicians who usually push their own special interests and show little knowledge about the economy or Fed. The report is a must-read and delves into everything the Fed looks at in making its policy decisions. The Q&A is the complete opposite, often unbearable, and as a long-time Fed watcher, we have still never been able to sit through an entire one, especially when he is in front of the House. However, replays can be found here and here.
"The process of getting inflation back down to 2% has a long way to go and is likely to be bumpy. As I mentioned, the latest economic data have come in stronger than expected, which suggests that the ultimate level of interest rates is likely to be higher than previously anticipated. If the totality of the data were to indicate that faster tightening is warranted, we would be prepared to increase the pace of rate hikes."
“…while housing services inflation remains too high, the flattening out in rents evident in recently signed leases points to a deceleration in this component of inflation over the year ahead.”

The Fed’s March Beige Book showed overall economic activity “increased slightly” so far in 2023. Half of the districts reported no change in conditions since January, while half noted expansion at a modest pace. Consumer spending was generally reported as holding steady, although a few districts noted a higher than seasonally normal activity level. Supply chain impairments continued to improve, helping auto inventories normalize further. Travel and tourism activity remained fairly strong in most districts. Demand for services remained “steady.” Manufacturing activity stabilized following a period of contraction at the end of last year. There was an uptick in housing activity along the east coast due to warmer weather. However, national housing markets remained subdued. Commercial real estate activity was steady, with some growth in the industrial market but ongoing weakness in the office market. Loan demand declined, credit standards tightened, and delinquency rates edged up. Amid heightened uncertainty, contacts did not expect economic conditions to improve much in the months ahead. Labor markets remained solid as employment continued to increase at a pace. There were hiring freezes by some firms and scattered reports of layoffs. Labor availability improved slightly, although finding workers with desired skills remained challenging. A lack of available childcare continued to impede labor force participation, and firms became less flexible with employees and began to reduce remote work options. Inflationary pressures remained widespread but moderated in many districts. Input costs rose further, particularly for energy and raw materials, though there was relief reported for freight and shipping costs. Some districts noted that firms were finding it more difficult to pass on cost increases to their consumers.

*Beige book came in more positive with strong labor markets and improving demand painting a better growth picture, although uncertainty remained notably high

*Supply chain improvements were more widespread this month, with rises in rates increasing the most as a concern despite reduced recessionary fears
The SF Fed’s research department produced a paper titled “Loose Monetary Policy and Financial Instability,” which found that when the stance of monetary policy is accommodative over an extended period, the likelihood of financial turmoil down the road increases considerably. The study provides the first evidence that the stance of monetary policy has implications for the financial system's stability, something we all know but unfortunately needs to be academically proven. In summary, as expected, a loose stance over an extended period of time leads to increased financial fragility several years down the line. The source of this fragility is associated with swings in those financial variables identified by the paper as “harbingers of financial turmoil.” Meanwhile, another paper was circulated by the National Bureau of Economic Research, which discovered evidence for a causal link between the U.S. economy and the global financial cycle. That paper showed that U.S. economic releases have large and significant effects on global risky asset prices. “Stock price indexes of 27 countries, the VIX, and commodity prices all jump instantaneously upon news releases,” the author found.

Technicals and Charts:
Four Key Macro House Charts:
Growth/Value Ratio: Growth is higher on the day and the week, and Large-Cap Growth is the best-performing size/factor on the week.

Chinese Iron Ore Future Price: Iron Ore futures are higher on the day and the week.

5yr-30yr Treasury Spread: The curve is steeper on the day and week.

EUR/JPY FX Cross: The Yen was stronger on the day and the week.

Other Charts:

Rates and equities have diverged as recessionary fears have increased, with markets ending the week with a significantly more risk-off flight to safety tone.

Hedge funds continue to reduce their exposure to the market.

Goldman Sachs still has a positive earnings growth outlook for 2023, encouraged by the stronger-than-expected start to the year and moving notably higher in 2024.

Realized vol has fallen notably since the start of the year following January’s rally and the more range-bound trading that followed after February’s initial pullback

0DTE or less than one-day options have been growing as a percentage of the total option volume on the S&P

Lapthorne at SocGen shows that shares of companies with the weakest balance sheets have outperformed recently, suggesting low fear of defaults.

"The Federal Deposit Insurance Corp. in February reported that U.S. banks' unrealized losses on available-for-sale and held-to-maturity securities totaled $620 billion as of Dec. 31, up from $8 billion a year earlier before the Fed's rate push began." – DJ

U.S. natural gas in storage remains near the 5-year high as warm weather and limited export ability keep prices down.

“The China reopening is the macro event of 2023 with implications for the flow of money and credit, potentially setting up the next phase of risk-on markets in H2 (graph courtesy of @AndreasSteno)” - @Marcomadness2
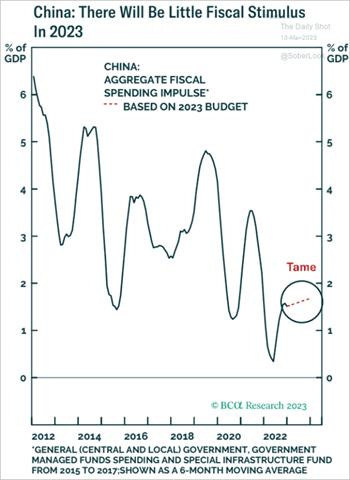
Fiscal stimulus is expected to be more muted in 2023, with Beijing still reluctant to fully stimulate the property sector due to debt overhang and structural concerns about the sustainability of that approach.
Articles by Macro Themes:
Medium-term Themes:
China’s Pandemic:
Downside Pressure: Exports fell by -6.8% in the first two months of 2023 on an annual basis, improving from December’s drop of -9.9% and a better outcome than the 9% drop predicted by economists. Imports contracted by -10.2% from a year earlier, far higher than the -7.5% decline in December and economists’ forecasts of a -5.5% drop. The trade surplus for the two months of this year was $117 billion. Economists said the sharp decline in imports was largely a result of weaker commodity prices and a stronger dollar rather than a sign of muted domestic demand. Trade data for the first two months of the year is typically combined to avoid distortions from the Lunar New Year holiday. - China’s Exports Extend Declines, Adding Pressure to Economy - Bloomberg

Longer-term Themes:
Cyber Life and Digital Rights:
More Business-Friendly: The U.K. government proposed a data protection law that it said would save companies from unnecessary compliance paperwork and boost the economy by more than $5 billion over the next decade. The bill, if approved, would be the U.K.’s first move away from the European Union’s General Data Protection Regulation since it left the union in 2020. One difference from the EU law is that companies with fewer than 250 employees won’t need to keep inventories of how they process personal data unless they use it for a purpose that will likely create a “high risk” to the individual’s freedoms and rights. The new bill doesn’t fundamentally change individuals’ privacy rights or companies’ main legal obligations, but it does make complying with the rules easier than under the GDPR. - U.K. Privacy Bill Aims to Reduce the Burden on Business – WSJ
Deep Fake Arms Race: As computer scientists devise better methods for algorithmically generating video, audio, images, and text, typically for more constructive uses, such as enabling artists to manifest their visions, they’re also creating counter-algorithms to detect such synthetic content. Recent research shows progress in making detection more robust, sometimes by looking beyond subtle signatures of particular generation tools and instead utilizing underlying physical and biological signals that are hard for AI to imitate. However, synthetic media creation and detection is an arms race, one in which each side builds on the other. Given a new detection method, someone can often train a generation algorithm to become better at fooling it. - Detection Stays One Step Ahead of Deepfakes—for Now – IEEE Spectrum

Energy’s Midlife Crisis:
Petering Out: The boom in oil production that over the last decade made the U.S. the world’s largest producer is waning, suggesting the era of shale growth is nearing its peak. Frackers are hitting fewer big gushers in the Permian Basin, America’s busiest oil patch, the latest sign they have drained their catalog of good wells. Shale companies’ biggest and best wells are producing less oil. “The world is going back to a world that we had in the ’70s and the ’80s,” said ConocoPhillips Chief Executive Ryan Lance, during a panel at the conference called CERAWeek by S&P Global. He warned that OPEC would soon supply more of the world’s oil. - U.S. Shale Boom Shows Signs of Peaking as Big Oil Wells Disappear – WSJ
Glut: A record surge in the supply of cobalt last year coincided with weaker demand in the second half, leaving the crucial battery metal in a massive surplus by the end of 2022. Mined cobalt supply grew by 23%, helping to wipe out a big deficit from a year earlier. At the same time, consumption was affected by a slowdown in demand from the electronics sector, which vies with the electric-vehicle industry as the biggest consumer of the battery metal. The glut in cobalt stands in sharp contrast to ongoing supply concerns for another key battery metal — lithium. Rising EV sales helped fuel a sharp rally in prices for both metals early in 2022, but cobalt has since slumped more than 60% from a June peak, while lithium has fallen far less aggressively. - The Cobalt Market Saw a Record-Breaking Supply Boom in 2022 - Bloomberg

Lower Energy Density: Lithium iron phosphate battery technology prevalent in China is making inroads in the U.S. electric-vehicle market, with manufacturers looking past poorer energy storage characteristics to embrace its cheaper cost and safety. LFP technology accounted for about half of the battery capacity of EVs sold in China last year, according to research from consultancy Adamas Intelligence. In the U.S., the technology represented only 9% of capacity in 2022, up from zero the year before. Snarled supply chains and U.S. efforts to loosen reliance on Chinese imports may also boost LFP technology in the U.S. - U.S. electric vehicle batteries poised for new lithium iron age - FT

Uncertain Transition: Oil-and-gas companies are still trying to figure out where to invest in the energy transition. The resulting hiatus makes for great shareholder returns but not a long-term strategy. The hot topics at CERAWeek by S&P Global, an annual industry gathering in Houston, are the impact on global energy markets of the Ukraine war and new opportunities from the Biden administration’s Inflation Reduction Act. One buzzword at this year’s conference is the need for an “orderly” energy transition. In the meantime, energy companies would ideally like more time to figure out which way to jump with new technologies and reap handsome oil-and-gas profits. But governments that want to reduce their reliance on fossil fuels and cut emissions are pushing in the opposite direction, including with hard cash. Today’s outsize shareholder returns may soon have to give way to a new era of investment. - Big Oil Gushes Cash Because It Doesn’t Know Where to Invest – WSJ

Food: Security, Innovations, and Climate Change Implications:
Out of Control Outbreak: The bird flu outbreak, which began early last year, is the biggest in the nation’s history, affecting more than 58 million farmed birds in 47 states, as well as birds in the wild. Officials at the federal Agriculture Department, which is responsible for the health of farm animals, say they have begun testing potential poultry vaccines and initiated discussions with industry leaders about a large-scale bird flu vaccination program for poultry, which would be a first for the United States. The outbreak may worsen in the months ahead as wild birds begin their spring migrations, bringing the virus with them. As a result, experts say egg prices could continue rising through the spring, driven in part by Easter season demand but also by supply shortages linked to the bird flu outbreak. - U.S. Considers Vaccinating Chickens as Bird Flu Kills Millions of Them - NYT

“Lacks Trade Fundamentals”: The Biden administration plans to escalate its conflict with Mexico over restrictions on genetically modified U.S. corn and other agricultural products with a request for formal consultations under their free-trade agreement. The Mexican government has moved to limit imports and use of U.S. GMO corn, saying that it could pose a danger to the health of the nation’s citizens. The US counters that Mexico’s concerns aren’t based on science. Mexico’s policies “will stifle the innovation that is necessary to tackle the climate crisis and food security challenges if left unaddressed,” US Trade Representative Katherine Tai said. “We hope these consultations will be productive as we continue to work with Mexico to address these issues.” - US Will Ask Mexico for Formal Talks, Escalating Fight Over GMO Corn - Bloomberg

Authoritarianism in Trouble?:
As Fast as False News: There is worldwide concern over false news and the possibility that it can influence political, economic, and social well-being. A study on Twitter from 2006 to 2017 found about 126K rumors were spread by 3 million people. False news reached more people than the truth; the top 1% of false news cascades diffused to between 1000 and 100,000 people, whereas the truth rarely diffused to more than 1000 people. Falsehood diffused significantly farther, faster, deeper, and more broadly than the truth in all categories of information, and the effects were more pronounced for false political news than for false news about terrorism, natural disasters, science, urban legends, or financial information. False news was more novel than true news, suggesting that people were likelier to share novel information. Whereas false stories inspired fear, disgust, and surprise in replies, true stories inspired anticipation, sadness, joy, and trust. Contrary to conventional wisdom, robots accelerated the spread of true and false news at the same rate, implying that false news spreads more than the truth because humans, not robots, are more likely to spread it. - False news spreads faster than the truth – MIT Management Sloan School

Cold Places (Deep Sea, Artic, and Space Colonization):
High Seas Biodiversity: An agreement on the wording of a historic United Nations treaty to protect marine biodiversity could mark the end of the unregulated exploitation of the ocean. The treaty does not regulate overfishing, a prime threat to ocean biodiversity, as fishing in international waters is managed by other organizations. But it does allow for the establishment of marine protected areas on the high seas, where fishing could be banned. That would enable the UN to move toward a target of conserving 30% of the ocean by 2030. The treaty also requires environmental impact assessments for potentially harmful activities, such as proposals to conduct geoengineering experiments in the ocean to combat climate change. Another main provision requires sharing with all nations any bounty from harvesting marine genetic resources, which includes marine molecules, bacteria, and algae that could be used in pharmaceuticals and other products. The treaty also provides for the transfer of marine technology to developing countries. - A Landmark UN Treaty Is Poised to Curb Exploitation of the Ocean - Bloomberg

Counter-space Capabilities: A Chinese satellite launched in 2018 has been inspecting other nations' spacecraft high above Earth in geostationary orbit. TJS-3, named vaguely as a communications experiment satellite, released a small subsatellite that orbital data reveals has been making close approaches to American satellites in recent months. U.S., Russian and Chinese satellites have all increasingly been scouting each others' satellites in GEO in recent years, using close approaches to attain images and other data. This has led to a game in which countries aim to learn about each others' spacecraft and test their counter-space and SSA capabilities. - A Chinese spacecraft has been checking out US satellites high above Earth – Space.com

VIEWS EXPRESSED IN "CONTENT" ON THIS WEBSITE OR POSTED IN SOCIAL MEDIA AND OTHER PLATFORMS (COLLECTIVELY, "CONTENT DISTRIBUTION OUTLETS") ARE MY OWN. THE POSTS ARE NOT DIRECTED TO ANY INVESTORS OR POTENTIAL INVESTORS, AND DO NOT CONSTITUTE AN OFFER TO SELL -- OR A SOLICITATION OF AN OFFER TO BUY -- ANY SECURITIES, AND MAY NOT BE USED OR RELIED UPON IN EVALUATING THE MERITS OF ANY INVESTMENT.
THE CONTENT SHOULD NOT BE CONSTRUED AS OR RELIED UPON IN ANY MANNER AS INVESTMENT, LEGAL, TAX, OR OTHER ADVICE. YOU SHOULD CONSULT YOUR OWN ADVISERS AS TO LEGAL, BUSINESS, TAX, AND OTHER RELATED MATTERS CONCERNING ANY INVESTMENT. ANY PROJECTIONS, ESTIMATES, FORECASTS, TARGETS, PROSPECTS AND/OR OPINIONS EXPRESSED IN THESE MATERIALS ARE SUBJECT TO CHANGE WITHOUT NOTICE AND MAY DIFFER OR BE CONTRARY TO OPINIONS EXPRESSED BY OTHERS. ANY CHARTS PROVIDED HERE ARE FOR INFORMATIONAL PURPOSES ONLY, AND SHOULD NOT BE RELIED UPON WHEN MAKING ANY INVESTMENT DECISION. CERTAIN INFORMATION CONTAINED IN HERE HAS BEEN OBTAINED FROM THIRD-PARTY SOURCES. WHILE TAKEN FROM SOURCES BELIEVED TO BE RELIABLE, I HAVE NOT INDEPENDENTLY VERIFIED SUCH INFORMATION AND MAKES NO REPRESENTATIONS ABOUT THE ENDURING ACCURACY OF THE INFORMATION