


2023: A Year of Growth, Returns, and Disinflation Nobody Anticipated - Midday Macro – 12/22/2023
Color on Markets, Economy, Policy, and Geopolitics

2023: A Year of Growth, Returns, and Disinflation Nobody Anticipated
Midday Macro – 12/22/2023
Market’s Weekly Narrative and Headlines:
Equities are ending the week positively, with the S&P, Dow, and Nasdaq all at all-time highs. Today’s weaker-than-expected PCE inflation data added to the belief that the Fed would be cutting rates sooner and faster than they have telegraphed. Small caps again outperformed, with the Russell now breaking above its two-year-old trading channel. Market breadth continues to improve, but RSIs indicate markets are now in very overbought territory. Please see our “Deeper Dive” section for more thoughts on where we see equities going in Q1 ’24. Treasuries were more range bound this week, with the 10yr yield ending at 3.9%, effectively ending the week where it started. Credit spreads ground tighter, continuing post-December FOMC momentum. Oil rallied because of geopolitical worries, as attacks in the Red Sea have raised shipping costs, while worries a greater conflict could emerge have increased risk premiums in energy more generally. Copper was flat on the week, while iron ore continued to rally. The agg complex was mixed, with the general index lower due to weakness in grains and beans, but softs were more mixed as always. Finally, the dollar was weaker, although flat today, despite the weaker PCE readings. The $DXY is ending the week around 101.7 with broader weakness in most major crosses outside the yen. Keeping the price review a little shorter this week, given the holiday trading. We give a brief overview of our Q1 equities outlook and the reasons for our positions in Japan and oil in the “Deeper Dive” section.

Deeper Dive:
We are ending the year with major U.S. equity indexes near all-time highs and yields down significantly in a short period of time based on a no-landing Fed pivot narrative. This week’s data continued to show an acceleration in housing and manufacturing activity. Further, the Fed’s favorite core PCE inflation measure was weaker than expected, although increases in real disposable incomes remained solid. Financial conditions continue to ease, with the post-December FOMC rally making things even looser. Numerous large acquisitions in the past week have shown an increasing optimism and desire to expand. To a lesser degree, regional Fed surveys showed improving outlooks despite still contractionary current readings. All in all, everything seems hunky-dory. Unfortunately, we still have trouble chasing risk in this perceived positive macro backdrop. With the belief that the Fed is worrying less about inflation and more about growth, the risks are rising that easier financial conditions triggered by the Fed’s pivot could start another rise in inflation. Rising incomes, both from salaries and financial assets, and an increasing wealth effect, means recent increases in consumer sentiment, mainly from falling gas prices, could translate into less price sensitivity more generally. Add in the current geopolitical backdrop, which has shipping costs and oil prices rising due to attacks out of Yemen, and it certainly seems like the supply-side cost push reduction that has driven inflation lower over the last year could at least take a pause. We still see a situation where growth is slowing (giving markets a reason to believe the Fed will become more dovish), but not by enough to derail tight labor markets, which are supporting consumer purchasing power, fast enough to move core-service inflation from its still persistent above-target levels. This increasingly leads the Fed to have to communicate it will maintain policy at its current restrictive level for longer than markets are pricing in Q1. This combination of slower growth and a more hawkish than expected Fed derails the current rally in rates and equities, and a moderate correction occurs in Q1. As a result of this outlook, we maintain our current mock portfolio positions. We will use the rest of our “Deep Dive” section to cover our Japan and oil outlook/positions.

*Leading economic indicators continue to be at levels that precede a recession. It would be strange not to at least get a below-trend period of growth in 2024

*Wages growth remains at levels above what would be needed to have core PCE at the Fed’s 2% target. Regional Fed surveys also predict it will increase next year

*Growth expectations have shot up for the U.S., and as predictions going into 2023 were too low, we feel 2024 ones are too high
Japan’s economy has recently become more of a mixed bag following a substantial post-pandemic recovery period. The gross domestic product finally recovered to its prepandemic size in real terms earlier this year. However, underlying growth more recently has mainly come from the external side, driven by exports and a surge in inbound tourism due to a weaker yen. Households and businesses are spending less, with final domestic demand weakening. At the same time, inflation has remained sticky, with price increases in services compensating for declines in the price of goods. In combination, this has complicated the BoJ’s potential path forward, with policymakers now facing inflation above target, a tight labor market pressuring wages higher, but a weaker growth outlook due to negative real incomes suppressing domestic personal consumption. Further, future foreign export demand remains uncertain, given that global growth is expected to slow, reducing business investment in the manufacturing sector.

*GDP turned negative in Q3 on falling private consumption and a decline in exports

*Household and business spending is broadly declining

*The Japanese UER has fallen recently, while job openings to applicants have increased
Japan’s economy will likely continue to slow now that it has recovered the output it lost during the pandemic. Slower economic activity will allow the BOJ to maintain its dovish monetary policy stance well into 2024. The challenge for the Bank of Japan now lies in promoting domestic inflation through wage-price spiral pressures and breaking decades of deflationary trends while limiting the risk of imported inflation by ensuring the yen doesn’t overly depreciate, making inflation too sticky. This dynamic remains stalled for now, with tight labor markets and employee recruitment problems intensifying but not by enough to fuel sufficient real wage growth to increase consumption. As a result, the start of normalization of monetary policy in Japan is not expected before the next collective wage negotiations in the spring of 2024, a deadline that coincides with the publication of a significant BoJ monetary policy review. Until then, negative interest rates will keep upward pressure on prices and wages despite final domestic demand not being expected to accelerate materially and business investment likely to decline. We continue to see the yen strengthening into this coming wage negotiation period as the tight labor environment will force greater concessions than originally forecasted by the BoJ, and this will alter the market’s policy expectations despite slowing growth. This macro backdrop will also weigh on domestic equities, with corporations seeing profits fall from record levels reached this summer due to reduced domestic and potentially foreign end demand. We also put less stock in any structural changes (through divestitures) that might unlock hidden value in Japanese equities. We have heard this story for a long time and question whether the corporate culture there has truly changed in any meaningful way. A stronger yen, will also reinforce weaker levels of repatriation from overseas ventures.

*Core inflation has been above the BoJ target for 19 consecutive months

*Tokyo’s own measure of inflation rose recently, showing a greater stickiness

*Consumer confidence has largely shrugged off higher inflation despite declines in actual spending. Will this last if service inflation remains sticky?
Oil has rebounded slightly from recent lows reached last week due to increased worries surrounding shipping in the Red Sea and the potential for a greater conflict in the Middle East to emerge. This has changed the tactical narrative in oil markets somewhat, which had previously been focused on record American production and growing inventory stock, an inability by OPEC and Russia to arrest price weakness due to worries regarding quota compliance, and weaker demand from China, the world’s largest importer. Add in Angola’s decision to leave OPEC being perceived as a nonevent due to production steadily falling there from a lack of investment, and hence, no excess capacity exists. It would be a different story if Nigeria decided to follow Angola’s lead, but so far, this does not seem likely. Elsewhere, the market is watching production outages in Kurdistan while production in Libya has stabilized. Also, Venezuela and Guyana are exploring diplomatic channels to resolve a territorial dispute, reducing worries that production there will be disrupted, but an outright conflict never seemed likely, nor are production levels high enough there to matter.

*U.S. production under Biden has reached record levels

*Inventories have moved back into more historically average levels

*U.S. refinery inputs are on the rise again after a weaker seasonal period
This year’s oil narrative has been one of too much supply, mainly from the U.S. Expectations are for supply to remain robust next year, which has the global oil market outlook for 2024 largely bearish. Despite expectations for OPEC+ to keep its deeper cuts and put a floor under prices, higher non-OPEC output will keep supply in surplus. This is despite potential increased demand, especially from Asia. OPEC expects demand to expand by 2.2 million barrels a day next year, while the International Energy Agency said in its latest Oil Market Report that oil demand will grow faster than previously expected. This upgrade by the IEA may be due to a stronger growth outlook (due to lower oil prices) and a belief that the energy transition away from fossil fuels is occurring at a slower pace as energy security is being prioritized over environmental pledges. The totality of the oil landscape going into 2024 has led many Wall Street analyst to reduce their expected trading price range. As a result, with WTI back at a mid-$70 level, we also maintain our view that prices will be range-bound, with the bottom of that range likely near the $68 low it touched last week. Hence, we maintain our bias to be long here, expressed through our $USO ETF long, with a target of around $80 in WTI due to positioning still being overly bearish. We think a further escalation in geopolitics could easily occur while fundamentals may improve due to rising demand out of Asia. A weaker dollar is also helping, and gains in oil are hedging current losses in our dollar-long position. The potential for a multi-day squeeze higher due to a bullish headline seems high, in our opinion.

*Demand out of China has been highly uncertain, but a stronger recovery could drive demand higher than expected

*Positioning has become increasingly bearish
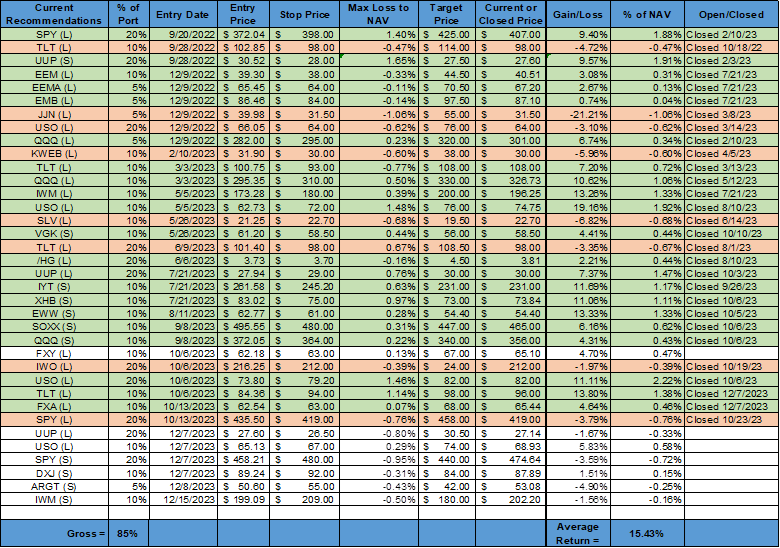
*We have truncated our portfolio a little, cutting off trades before the fall of 2022. We moved our oil stop higher and adjusted our $UUP starting price, given that an extraordinarily large special dividend was paid this week, which lowered the price by almost 10%. Given that any holder of the ETF would have received that dividend, we did not want to reflect it in our returns, which we look to mimic the $DXY index.
Happy Holidays to all our readers! It has been an eventful and humbling year, as most have been recently. We will be returning in the second week of January.
As always, thank you for reading, and please share our newsletter. Please feel free to reach out with any questions or comments. – Michael Ball, CFA, FRM
Policy Talk:
The Fed officials who spoke this week mostly pushed back on the dovish interpretation of the December FOMC meeting. New York Fed President Williams said Fed officials weren’t actively debating when to cut rates yet, an apparent effort to temper markets’ dovish interpretation of Chair Powell’s comments and new December SEPs last week. Cleveland Fed President Mester also said financial markets had got "a little bit ahead" of the central bank on when to expect interest rate cuts. "The next phase is not when to reduce rates, even though that's where the markets are at. It's about how long do we need monetary policy to remain restrictive in order to be assured that inflation is on that sustainable and timely path back to 2%," Mester said in an FT interview. Chicago Fed President Goolsbee noted the Fed may need to change course if inflation continues to trend toward its 2% target rate and remained worried about a potential recession. Richmond Fed President Barkin commented the Fed was making good progress but was unsure when it would be appropriate to cut rates. He noted inflation was still running above the central bank’s 2% target and has proven more stubborn than expected. “We’re not yet done with inflation,” he said. San Francisco President Daly thinks that if inflation continues its steady decline of recent months, the Fed’s benchmark interest rate “will still be quite restrictive even if we cut three times next year.” But Daly also said it was too soon to speculate at which meetings the Fed might change its policy stance. Atlanta Fed President Bostic said there is no current "urgency" for the Federal Reserve to reduce U.S. interest rates, given the strength of the economy and the need to be sure that inflation will return to the central bank's target. Bostic repeated that he expects two quarter-point rate cuts likely in the second half of the year.

U.S. Economic Data:
The personal consumption expenditure price index declined by -0.1% in November, below a flat reading in October, compared to forecasts of no change. This moved the annual rate lower to 2.6% from 3% in October. Core PCE rose by 0.1% MoM, the same as in October, and below market expectations of a 0.2% MoM rise. The annual core PCE rate decreased to 3.2% from 3.4% in October. The prices for goods decreased by -0.7% MoM, with durable goods decreasing by -0.4% MoM (vs. -0.3% MoM in Oct) and nondurable goods decreasing by -0.9% MoM (vs. -0.3% MoM). Prices for services increased by 0.2% MoM, the same rate as in October. Food prices decreased by -0.1% MoM, following a 0.2% MoM increase in the prior month, while energy prices decreased by -2.7% MoM, the same as in October.
Key Takeaways: The larger-than-expected decline was driven by goods and energy. The notable decline in nondurables was due to gasoline and other energy goods falling -5.6% MoM, a greater level than October’s -4.6% decline. Housing and utilities accelerated its monthly increase from 0.4% MoM to 0.6% MoM in November, while transportation services rose notably by 1.1% MoM. Food services also slightly reaccelerated after a flat reading last month. However, the closely watched health care was effectively flat on the month after picking up in the prior. Markets and the Fed will undoubtedly see this report as reaffirming the current disinflationary narrative, as evidenced by price action following the report. However, given that much of this is energy-driven, and that may be reversing, we are more skeptical about whether this report in conjunction with the totality of the data elsewhere, gives a green light for a March rate cut.

*Monthly gains in PCE have again been trending lower after a slight uptick in the fall

*The six-month annualized core PCE rate is now officially below the Fed’s 2% target, hitting 1.87% in November. Should we report a murder of inflation?
Personal income increased by 0.4% to $81.6 billion in November, following a 0.3% rise in October. Personal income, ex-government transfers, increased by 0.6% MoM, driven higher by wages and salaries (0.6% MoM). Personal income receipts on assets remained strong, rising 0.4% MoM, but cooling from a 0.8% rise in October. Real disposable income increased by 0.4% MoM, following a 0.3% rise in October. The savings rate increases to 4.1% due to real income gains. Personal spending increased by 0.2% in November, following a downwardly revised 0.1% increase in October and below forecasts of a 0.3% advance. The $46.7 billion increase in the month reflected an increase of $58.8 billion in spending for services and a decrease of $12.1 billion for goods. Within services, the largest contributors to the increase were housing and food services. Within goods, the leading contributor to the decrease was gasoline.
Key Takeaways: There were strong income gains in November, supporting solid spending to close the year. Real disposable income is consistently increasing, and this supports the savings rate. It's hard to see inflation falling too much faster with real incomes rising now that supply-side disinflationary drivers could stall. This is also on top of higher income derived from financial assets and a greater wealth effect from rising values there. On the spending side, decreases in gas prices are now driving overall spending amounts lower for goods. With oil looking to have bottomed and RBOB slightly higher in December, energy-derived effects on the data may start to reverse.

*November saw solid gains for real disposable income while spending on goods fell due to lower prices at the pump
New orders for manufactured durable goods increased by 5.4% in November, reversing a -5.1% decline in October and significantly beating market expectations of a 2.2% increase. As expected, transportation equipment drove headline gains, rising 15.3% in November, following a -13.4% MoM decline in October, due to an 80.1% MoM increase in nondefense aircraft orders. Excluding transportation, new orders increased by 0.5%. New orders for nondefense capital goods, excluding aircraft, increased by 0.8% MoM. There were broad monthly gains in the subcategories more generally, with new orders for primary and fabricated metals, machinery, computers and electronic products, and electrical and appliances all higher on the month. Motor vehicles and parts rebounded from UAW shutdowns, rising 2.8% in November following a -4.1% decline in October. Shipments increased by 1% in November, reversing a 0.8% decline in the prior month. Unfilled orders rose by 1.3% MoM, while total inventories were flat, increasing by a modest 0.1% MoM.
Key Takeaways: It was the biggest gain in durable goods orders since July 2020 due to a large increase in aircraft orders, while the end of the UAW strike saw a rebound in auto production. However, gains were broad in other categories, with core capital goods rising at a solid pace. Actual new orders for durable goods are proving to be more resilient than manufacturing PMI data indicates.

*Increases in orders for aircrafts and autos drove durable goods new orders higher in November
Sales of existing homes increased by 0.8% MoM to 3.82 million SAR in November, increasing from 3.79 million in October and above forecasts of 3.77 million. Existing home sales are -7.2% lower than one year ago. The total housing inventory was 1.13 million units, declining by 1.7% MoM but increasing by 0.9% from one year ago. Unsold inventory sits at a 3.5-month supply at the current sales pace, down from 3.6 months in October but up from 3.3 months in November 2022. The median existing-home price moved to $387,600, an increase of 4% from November 2022, with prices increasing in all four regions.
Key Takeaways: Existing home sales rose for the first time in five months, rising from an October level that was the lowest since August 2010. The greater level of transactions directly benefited from a fall in mortgage rates, and this should continue. "The latest weakness in existing home sales still reflects the buyer bidding process in most of October when mortgage rates were at a two-decade high before the actual closings in November," said NAR Chief Economist Lawrence Yun. "A marked turn can be expected as mortgage rates have plunged in recent weeks." For 2024, the National Association of Realtors predicts 4.71 million existing-home sales, up 13.5% from 4.1 million anticipated in 2023. Annual median home prices are expected to remain largely unchanged at the national level in 2024, for the second straight year, modestly improving affordability from rising income. "Home prices keep marching higher," Yun added. "Only a dramatic rise in supply will dampen price appreciation."

*Low inventory levels are pressuring existing home sales lower and prices higher

*Inventories are still tight but are now above 2021 and 2022 levels

*Rising levels of mortgage application indicate higher future existing home sales
Housing starts increased by 14.8% MoM to an annualized 1.56 million in November, the highest rate in six months and well above market forecasts of 1.36 million. Figures for October were revised lower to 1.359 million from an initial 1.372 million. Starts for single-family homes jumped 18% to 1.143 million, the highest level since April 2022. Multi-unit starts increased by 8.9% to 404K. Starts increased in the Northeast (100% to 144K), the South (16.3% to 849K), the West (2.1% to 347K) and the Midwest (1.4% to 144K). Building permits declined by 2.5% to 1.46 million SAR in November, below market expectations of 1.47 million, preliminary data showed. Multi-unit permits declined by 9.6%, while single-family permits increased by 0.7%. Permits declined in the Northeast (-34.4% to 84K) and the South (-6.7% to 795K) but rose in the Midwest (12.4% to 191K) and the West (12.1% to 390K). Housing completions increased by 5% in November but are -6.2% below the November 2022 rate.
Key Takeaways: Total housing starts in November were well above expectations; however, starts in September and October were revised down slightly combined. Some “new” seasonal patterns contributed to the outsized gains. However, with that said, this new data showed builders continue to benefit from a shortfall in listings of previously-owned homes, enticing buyers with incentives such as subsidized mortgage rates and price cuts. That’s helped ease the pain of the worst affordability on record. Looking at the bigger picture, multi-unit starts declined by -33.1% year-over-year in October, while single-family starts are now up by 42.2% year-over-year, thanks to the big increase in November. When combined, the annualized pace of new-home starts is on par with pre-pandemic rates, suggesting the toll on gross domestic product from weak residential investment is beginning to ease. "American housing demand is permanently higher than before the pandemic since people are spending more time at home," said Bill Adams, chief economist at Comerica Bank in Dallas. "As long-term interest rates fall, builders will add more supply to the housing market to meet that demand, fueling economic growth."

*Single housing starts jumped in November and are higher by 43,7% YoY, while multi-unit starts are negative

*Building permits rose by a weaker level in November due to decreases in multi-units
The NAHB/Wells Fargo Housing Market Index increased to 37 in December from 34 in November, beating forecasts of 36. The sub-index for current single-family home sales remained steady at 40, while the sub-index for expected home sales over the next six months increased to 45 from 39. Additionally, the gauge for prospective buyers increased to 24 from 21. In December, 36% of builders reported cutting home prices, tying the previous month’s high point for 2023. The average price reduction in December remained at 6%, unchanged from the previous month. Meanwhile, 60% of builders provided sales incentives of all forms, the same as in November but down slightly from 62% in October.
Key Takeaways: December was the first improvement in sentiment in five months, with November being the lowest reading in nearly a year. The improved sentiment was driven by declining mortgage rates, which declined by roughly 50 bps over the month, which sparked increased interest among potential buyers and raised expectations for sales. “The housing market appears to have passed peak mortgage rates for this cycle, and this should help to spur home buyer demand in the coming months," said NAHB Chief Economist Robert Dietz. Dietz added that the recent pessimism in builder confidence this fall has been somewhat counter to gains for the pace of single-family permits and starts during this time frame. “Our statistical analysis indicates that temporary and outsized differences between builder sentiment and starts occur after short-term interest rates rise dramatically, increasing the cost of land development and builder loans used by private builders,” Dietz noted. Finally, with mortgage rates around 7% throughout November, per Freddie Mac data, many builders continue reducing home prices to boost sales.

*Builder sentiment rebounded from recent lows due to lower mortgage rates improving future expectations

*Gains in expected sales and buyer traffic drove the overall index higher
The Conference Board Consumer Confidence Index increased to 110.7 in December, rising from a downwardly revised 101.0 in November. The Present Situation Index increased to 148.5 from 136.5 last month. The Expectations Index increased to 85.6 from its downwardly revised reading of 77.4 in November. The average one-year ahead inflation expectations declined to 5.6%. Consumers' assessment of the current business conditions and labor markets improved. Future expectations six months ahead also showed less pessimism regarding short-term business conditions, labor market outlook, and income prospects. Consumers’ assessment of their family’s current financial situation pulled back slightly in December but became considerably more optimistic when assessing their family’s expected financial situation six months ahead. Consumers’ perceived likelihood of a recession over the next year declined in December to the lowest levels seen this year. However, two-thirds still perceive a downturn as possible.
Key Takeaways: This sharp increase in December moved the expectation index back to the levels of optimism last seen in July. Increases in expectations reflected a broad improvement in all sub-readings, with future business, labor market, and personal finance prospects improving. Respondents showed greater confidence in their ability to get a job, with the labor differential reading (jobs plentiful minus hard to get) rising after trending lower for most of the year. Inflation expectations eased further, continuing a downward trend there. “While December’s renewed optimism was seen across all ages and household income levels, the gains were largest among householders aged 35-54 and households with income levels of $125,000 and above. December’s write-in responses revealed the top issue affecting consumers remains rising prices in general, while politics, interest rates, and global conflicts all saw downticks as top concerns,” said Dana Peterson, Chief Economist at The Conference Board.

*Confidence rose due to broad improvements in current and future readings

*Job sentiment improved while inflation expectations fell

*Perceptions of current financial situations were the one area of the report that weakened in December
The Philadelphia Fed Manufacturing Index declined to -10.5 in December from -5.9 in the prior month, worse than market estimates of -3. Current activity and demand readings were mixed, with New Orders (-25.6 vs. 1.3) dropping sharply, while Shipments (-10.8 vs. -17.9) and Unfilled Orders (-7.9 vs. -9.8) contracted at a reduced rate. Deliver Times (-16.8 vs. -8.7) shortened, and Inventories (-4.2 vs. -3.1) were little changed and seen as slightly low. Inflation readings were mixed, with Prices Paid (25.1 vs. 14.8) rising notably and Prices Received (13.6 vs. 14.8) expanding at a slightly reduced rate. Labor market readings were also mixed, with the Number of Employees (-1.7 vs. 0.8) contracting, while the Average Workweek (-5 vs. -11.4) contracting at a reduced rate. Future readings were mixed, with demand and activity expanding, while prices expanded at a reduced rate and employment readings declined. Finally, capex intentions contracted at a faster rate.
Key Takeaways: Manufacturing activity in the Philly region continued to decline overall, with December reading the 17th negative one in the past 19 months. Most future activity indicators rose, suggesting more widespread expectations for overall growth over the next six months. At the current readings level, there was an outsized contraction in new orders, but otherwise, firms reported steady levels of employment and improvements in shipment levels. In totality, combining current and future readings, prices fell despite the large rise in current prices paid. The special question for the month asked firms to estimate their total production growth for the fourth quarter compared with the third quarter. A higher share of firms reported a decrease in production (44%) compared with the share reporting an increase (21%). Regarding firms’ capacity utilization rates, the reported median current capacity utilization rate was unchanged at 70 to 80%. Most firms reported labor supply as at least a slight constraint to capacity utilization in the current quarter, although the share reporting it as a moderate or significant constraint (35%) declined from when this question was asked in September (49%). Half of the firms reported supply chains were not at all a constraint, and looking ahead over the next three months, most firms expect the impacts of various factors to stay the same.

*The current general activity index fell further in December, while future readings improved

*There was a large decline in new orders, while future readings moved in a Fed-friendly way
The Kansas City Fed’s Manufacturing Production index was at -4 in December of 2023, little changed from -3 in the previous month. Demand and activity measures were tilted more negatively during the month. New Orders (-8 vs. 0) contracted from a neutral reading last month, while the Backlog of Orders (-5 vs. -12) declined further. On a positive note, New Orders for Exports (1 vs. -4) moved back to a more neutral reading. Production (-4 vs. -3) contracted at a slightly faster rate, while Shipments (-3 vs. 5) moved back into negative territory. Inventory readings expanded, with Inventories of Materials (1 vs. 0) and Finished Goods (4 vs 0) both rising. Delivery Times (1 vs. -5) moved to a near-neutral reading. Labor readings improved, with the Number of Employees (8 vs. -3) jumping and the Average Workweek (0 vs. -4) moving to neutral. Inflation measures rose, with Prices Received (3 vs. -3) expanding again, while Prices Paid (9 vs. 7) moved higher. Six-month ahead readings were broadly positive, with the overall index expanding due to rises in activity, demand, labor, and price measures. Capex intentions fell and are negative after three months of growth.
Key Takeaways: Regional manufacturing activity around Philadelphia changed little in December, with expectations for future growth improving. The production, shipments, and new orders indexes all had slightly negative values, while employment activity experienced a rebound. Moreover, after several stagnant months, inventories for raw materials and finished goods witnessed a minor increase. “Regional factory activity stayed steady in December, and expectations for future activity rebounded,” said Wilkerson. “Accordingly, firms increased their number of employees this month, with further increases expected.” Activity for nondurable goods rose, particularly for food & beverage and plastics manufacturing, while activity declined slightly for durable goods, driven by primary metal and furniture manufacturing. Contacts were asked about expectations for demand and capital expenditures in 2024. 42% of firms expect demand for their products to be slightly higher in 2024 and 6% expect it to be significantly higher, while 22% of firms expect no change. 32% of firms expect capital expenditures to be unchanged in 2024, while 28% expect them to be slightly higher and 10% significantly higher. Only 18% of firms expect to capital expenditures to be slightly lower, and another 12% expect significantly lower expenditures.

*The overall KC Manufacturing Index moved higher to a neutral reading

*Current readings showed weaker demand and activity, with broad gains elsewhere

*Six-month ahead readings were more broadly positive, with a notable uptick in prices paid

*Capital expenditure plans for 2024 skew to the positive
The New York Fed’s Business Leaders (Service Sector) Survey general business activity reading contracted further to -14.6 in December from -11.9 in November. Readings on Business Activity (-14.6 vs. -11.9) and the general Business Climate (-38.4 vs. -37.1) contracted at a faster rate. Labor readings also weakened with the Number of Employees (-1.2 vs. 3.8) contracting and Wages (25.9 vs. 31.6) expanding at a reduced rate, continuing to trend lower. Inflation measures were mixed, with Prices Paid (46.9 vs. 55.1) expanding at a reduced rate while Prices Received (23.1 vs. 19.7) expanding faster. Current Capital Spending (1.3 vs. 8.9) moved close to neutral. Forward-looking indicators were slightly more upbeat, with overall business activity expanding off neutral readings in the prior month. The forward business climate reading improved but remained negative while hiring intentions rose, and price readings were mixed, with expectations for prices received trending higher. Finally, future capital spending plans fell notably, moving closer to neutral.
Key Takeaways: Service sector business activity contracted at a slightly greater pace in December. General business activity and climate measures worsened while employment growth stalled. Notably, current and future prices received measures rose, with firms indicating a greater ability to increase final customer prices. Finally, capex activity and plans moved to neutral, with declines in forward-looking readings negating improvements in expected business activity and climate readings.

*The NY Fed’s Service Sector PMI has been mainly in negative territory this year

*Labor reading weakened on the month, with both employment and wages trending lower recently

*Input costs declined while prices received rose further
Technicals, Positioning, and Charts:
The Russell outperformed the Nasdaq and S&P on the week. Communication, Energy, and Marterials were the best-performing sectors, while Small-Caps, Momentum, and Growth were the best-performing factors. Small-cap Core was the best-performing size/value combo of the week.

@Koyfin
S&P optionality strike levels have the Zero-Gamma Level at 4684 while the Call Wall is 5000 and the Put Wall is 4720.

@spotgamma
S&P technical levels have support at 4780, then 4750, with resistance at 4810, then 4830.

@AdamMancini4
Treasuries are mixed on the day, with the 10yr yield a little changed at 3.90%, while the 5s30s curve is steeper by 2 bps on the session, moving to 18 bps.

Four Key Macro House Charts:

Growth/Value Ratio: Growth is higher on the week, however, Small-Cap Core is the best-performing size/factor on the week.

Chinese Iron Ore Future Price: Iron Ore futures are higher on the week.

5yr-30yr Treasury Spread: The curve is steeper on the week.

EUR/JPY FX Cross: The Yen is stronger on the week.
Other Charts:

U.S. equities have been the clear winner this year, mainly due to the performance of mega-caps driven by the positive AI narrative.

BoA’s recent Global Fund Manager Survey showed that investors are the most overweight equities relative to cash since Jan’22.

Managers are becoming less convinced that leadership will remain among the large caps, given the recent rally in small caps.

Investors have become more bullish since the recent lows in October but were still more positive in 2021.

Share buybacks have been strong in recent weeks, helping to fuel the rally.

Cyclicals have outperformed defensives over the entirety of 2023.

The recent swing in rate pricing has kicked off a very large dollar selloff. Over the last seven weeks, the USD's decline is about as large as these drops have been over the past decade. - @Bespokeinvest

Despite the recent drop in mortgage rates, most homeowners locked in low rates during the pandemic.

South Korea’s exports surged in December, ending the year with strong momentum.

The PBoC has been expanding its balance sheet.
Articles by Macro Themes:
Read a book over the break!
VIEWS EXPRESSED IN “CONTENT” ON THIS WEBSITE OR POSTED IN SOCIAL MEDIA AND OTHER PLATFORMS (COLLECTIVELY, “CONTENT DISTRIBUTION OUTLETS”) ARE MY OWN. THE POSTS ARE NOT DIRECTED TO ANY INVESTORS OR POTENTIAL INVESTORS AND DO NOT CONSTITUTE AN OFFER TO SELL -- OR A SOLICITATION OF AN OFFER TO BUY -- ANY SECURITIES AND MAY NOT BE USED OR RELIED UPON IN EVALUATING THE MERITS OF ANY INVESTMENT. THE CONTENT SHOULD NOT BE CONSTRUED AS OR RELIED UPON IN ANY MANNER AS INVESTMENT, LEGAL, TAX, OR OTHER ADVICE. YOU SHOULD CONSULT YOUR OWN ADVISERS AS TO LEGAL, BUSINESS, TAX, AND OTHER RELATED MATTERS CONCERNING ANY INVESTMENT. ANY PROJECTIONS, ESTIMATES, FORECASTS, TARGETS, PROSPECTS AND/OR OPINIONS EXPRESSED IN THESE MATERIALS ARE SUBJECT TO CHANGE WITHOUT NOTICE AND MAY DIFFER OR BE CONTRARY TO OPINIONS EXPRESSED BY OTHERS. ANY CHARTS PROVIDED HERE ARE FOR INFORMATIONAL PURPOSES ONLY, AND SHOULD NOT BE RELIED UPON WHEN MAKING ANY INVESTMENT DECISION. CERTAIN INFORMATION CONTAINED IN HERE HAS BEEN OBTAINED FROM THIRD-PARTY SOURCES. WHILE TAKEN FROM SOURCES BELIEVED TO BE RELIABLE, I HAVE NOT INDEPENDENTLY VERIFIED SUCH INFORMATION AND MAKE NO REPRESENTATIONS ABOUT THE ENDURING ACCURACY OF THE INFORMATION. I MAY OR MAY NOT HAVE POSITIONS IN ANY STOCKS OR ASSET CLASSES MENTIONED. I HAVE NO AFFILIATION WITH ANY OF THE COMPANIES OTHER THAN EXPLICITLY MENTIONED.